
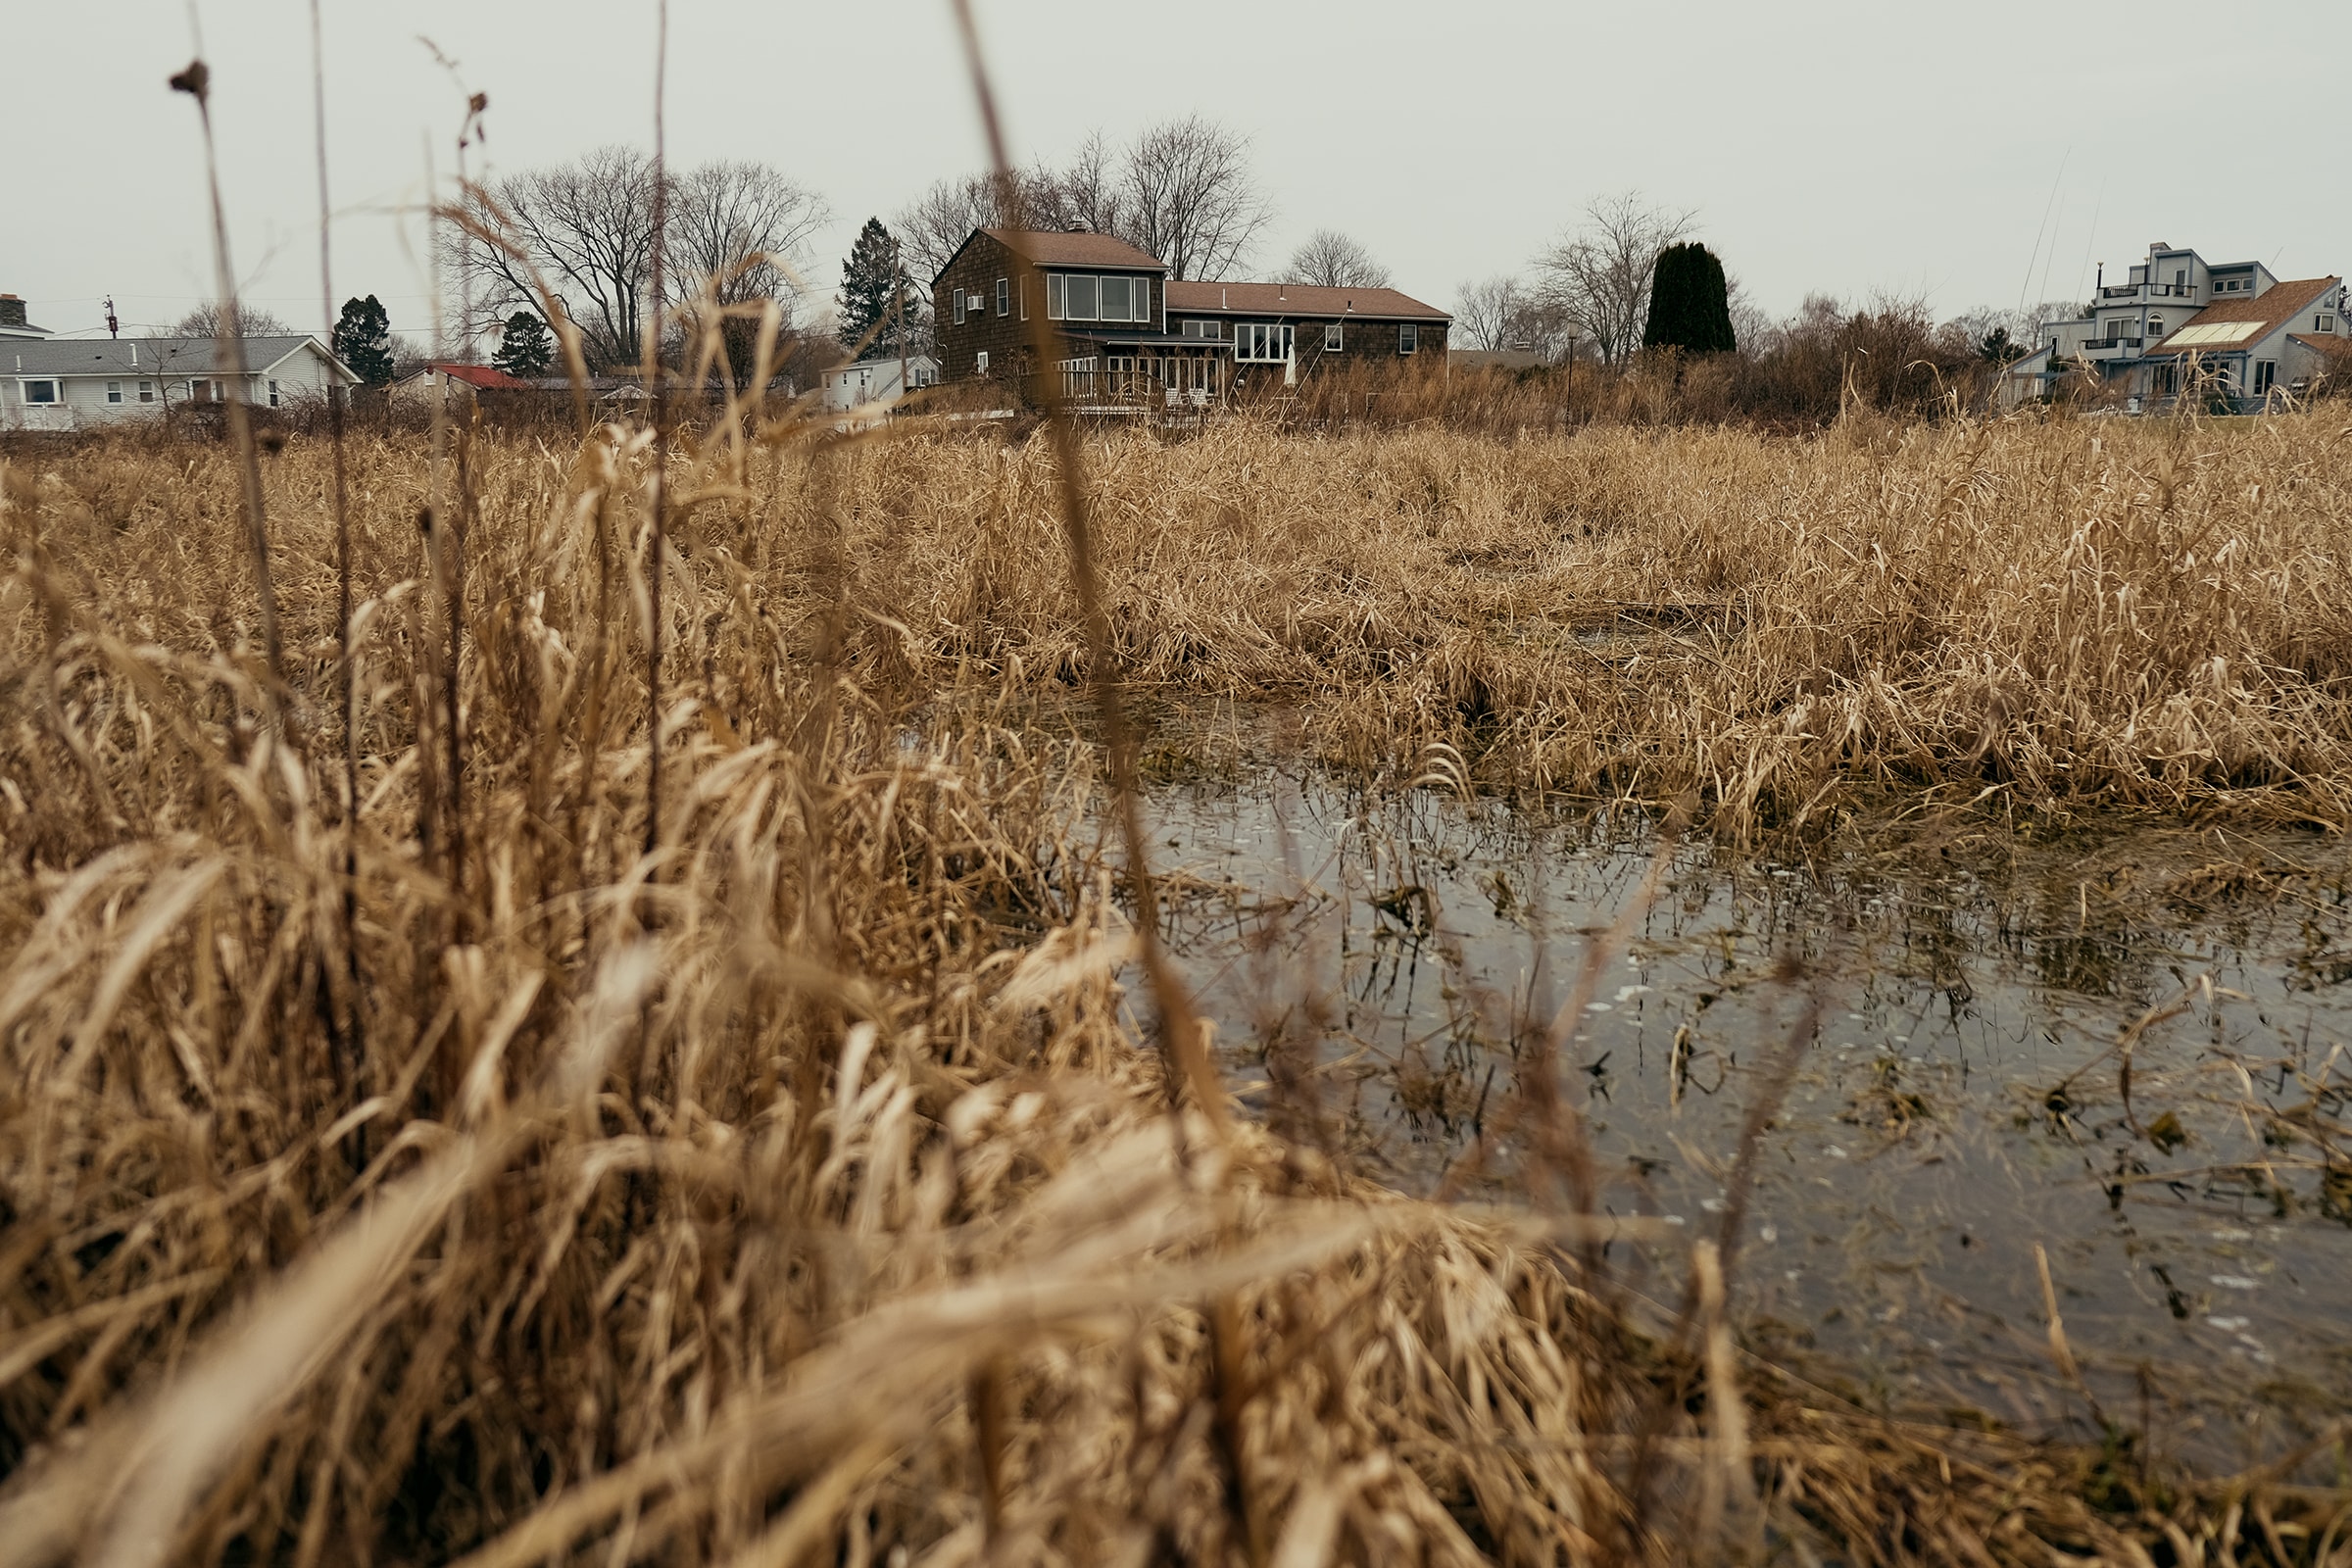
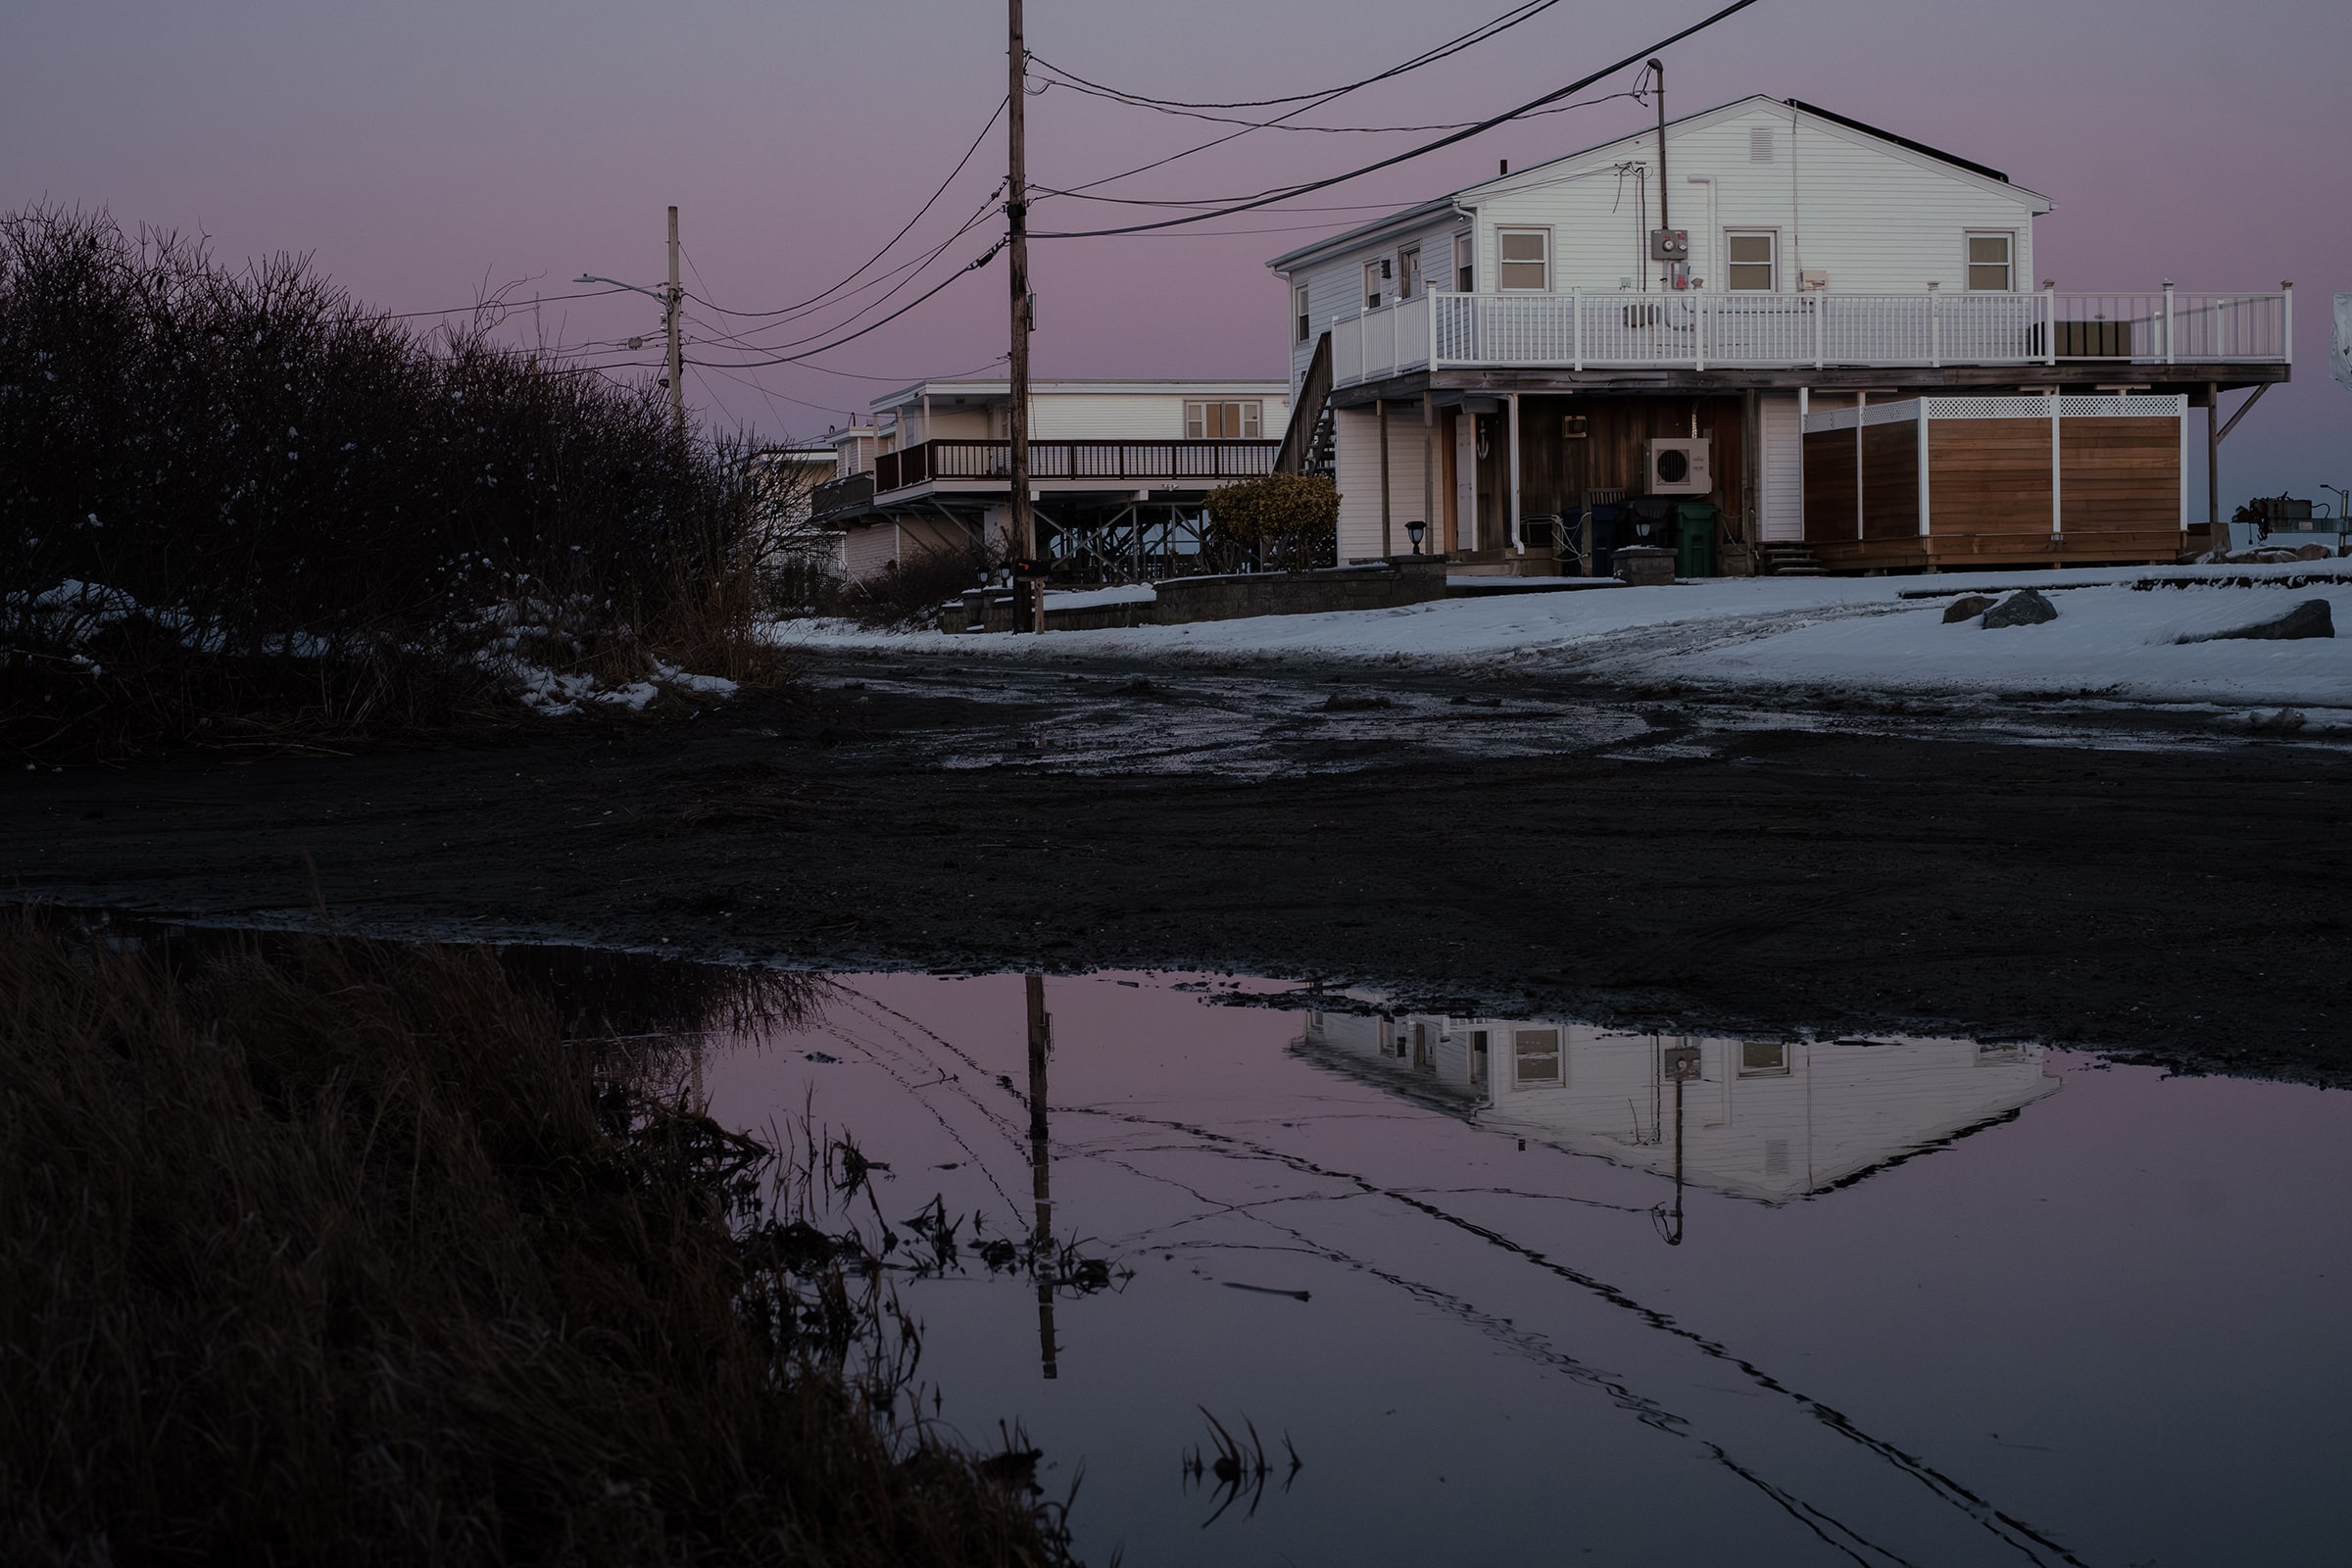
At dawn the ducks come in with the tide to feed on bivalves in the inlet beside Armand Deluise’s house. Their squawking is his alarm clock. “Being on the water is in our DNA,” he says.
His grandfather emigrated from a small island off the coast of Naples, and since 1925 the family has lived in Conimicut, a fishing village in Rhode Island, where the Providence River opens onto Narragansett Bay. In these hundred years, they’ve seen high water. Armand’s mother rode out the Great New England Hurricane of 1938, when the water rose to the second floor of the house on Shawomet. Wiser the next time, the family evacuated for the two hurricanes in 1954.
I woke up this morning, and I couldn’t believe the sand was gone.
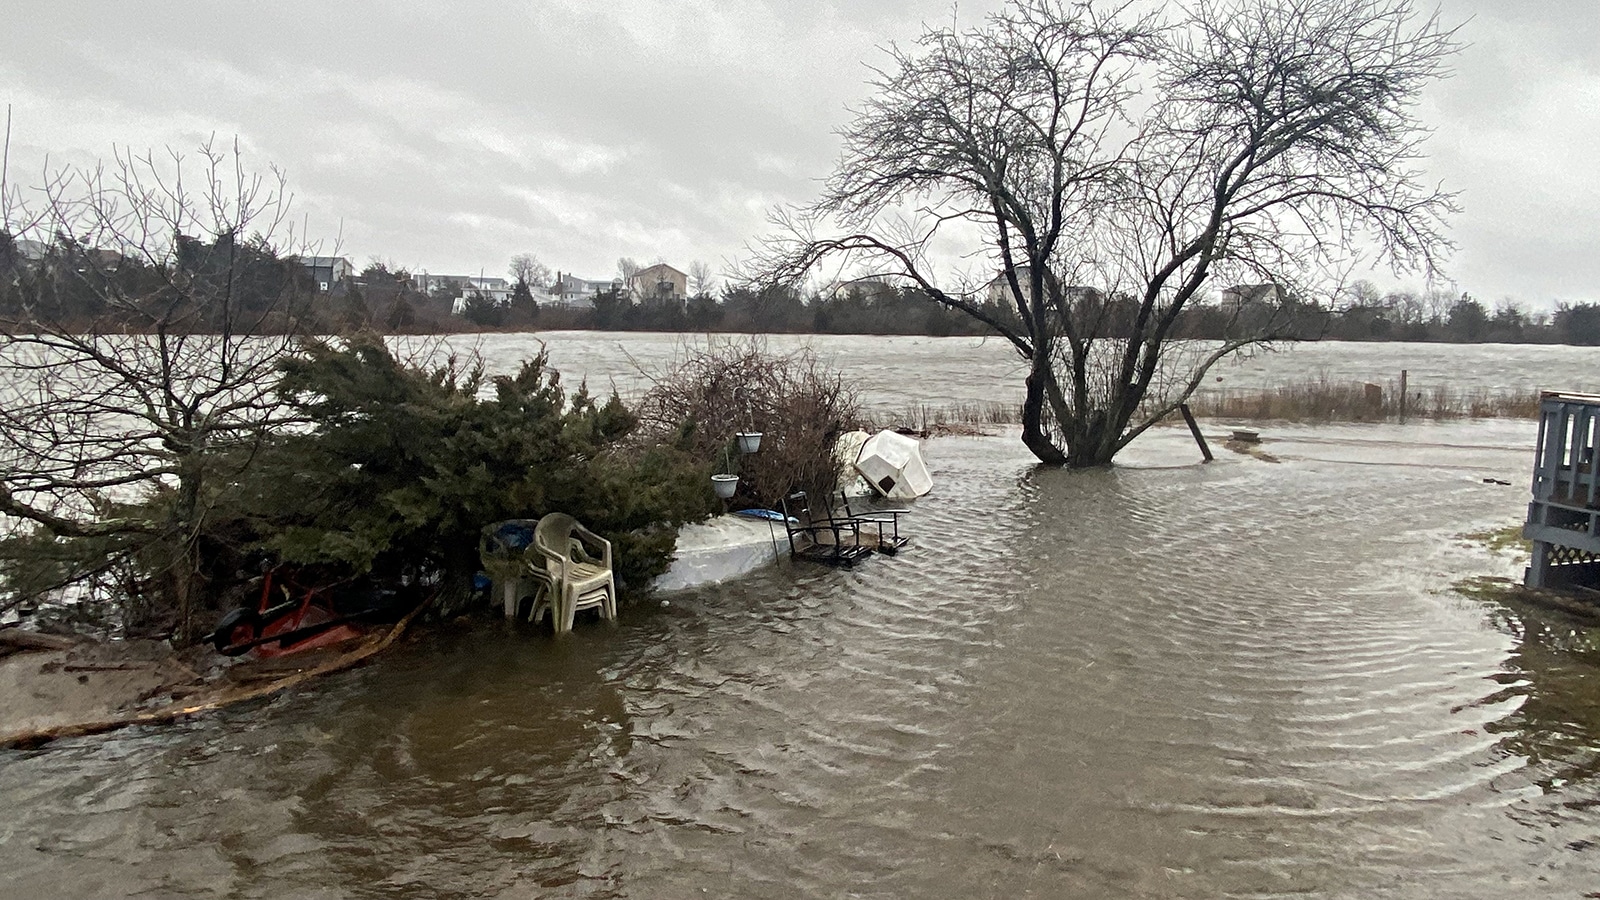
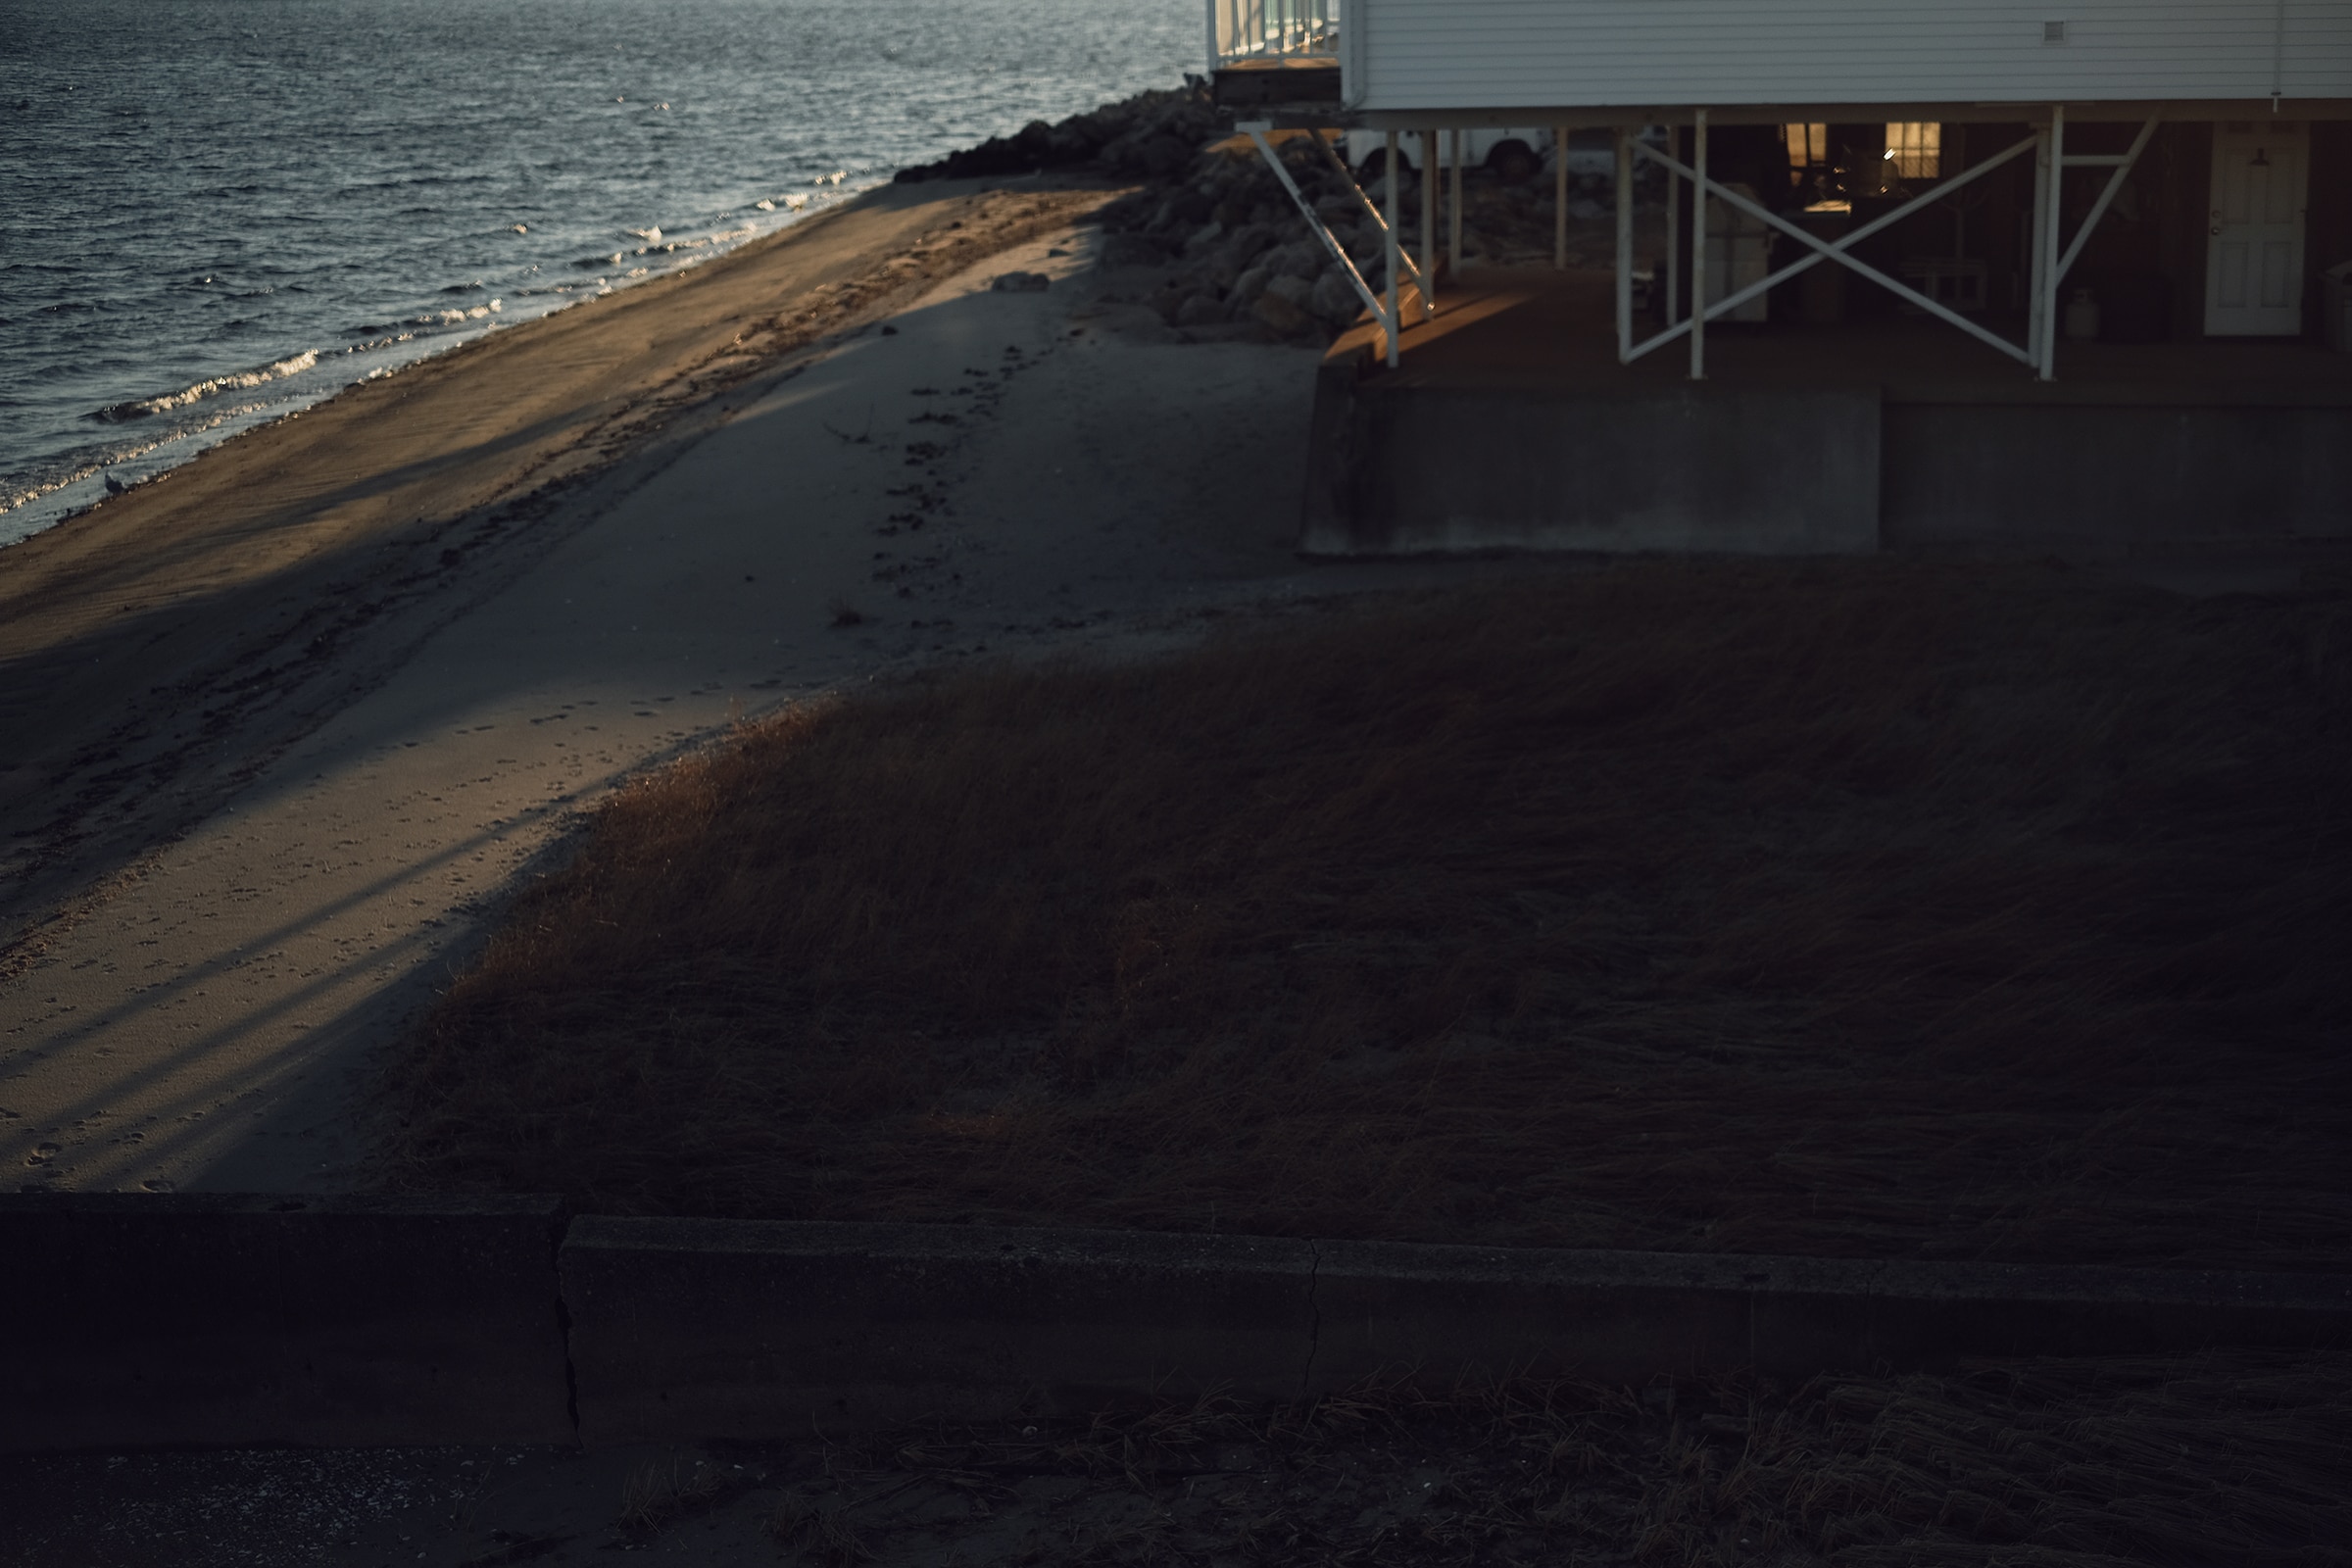
Armand now lives a few blocks away, on Spadina Avenue. From his backyard he can see the beach at the mouth of the inlet. “I woke up this morning, and I couldn’t believe the sand was gone,” he says. “Even fifteen years ago, this beach was never covered at high tide.”
A wrack line rings the foundation of his house, mostly dead marsh grass left a month ago by a storm that brought the tidal waters up to his back steps. It’s happening all the time. The storms don’t even have names. Forget Carol and Edna in 1954; Irene in 2011; Sandy in 2012. Now it’s just another heavy rain. Eight inches fell in July 2023, an anomaly. Then, in September, a slow thunderstorm caused tornados and flash floods across several states, in what the newspapers called a “200-year rainfall event.”
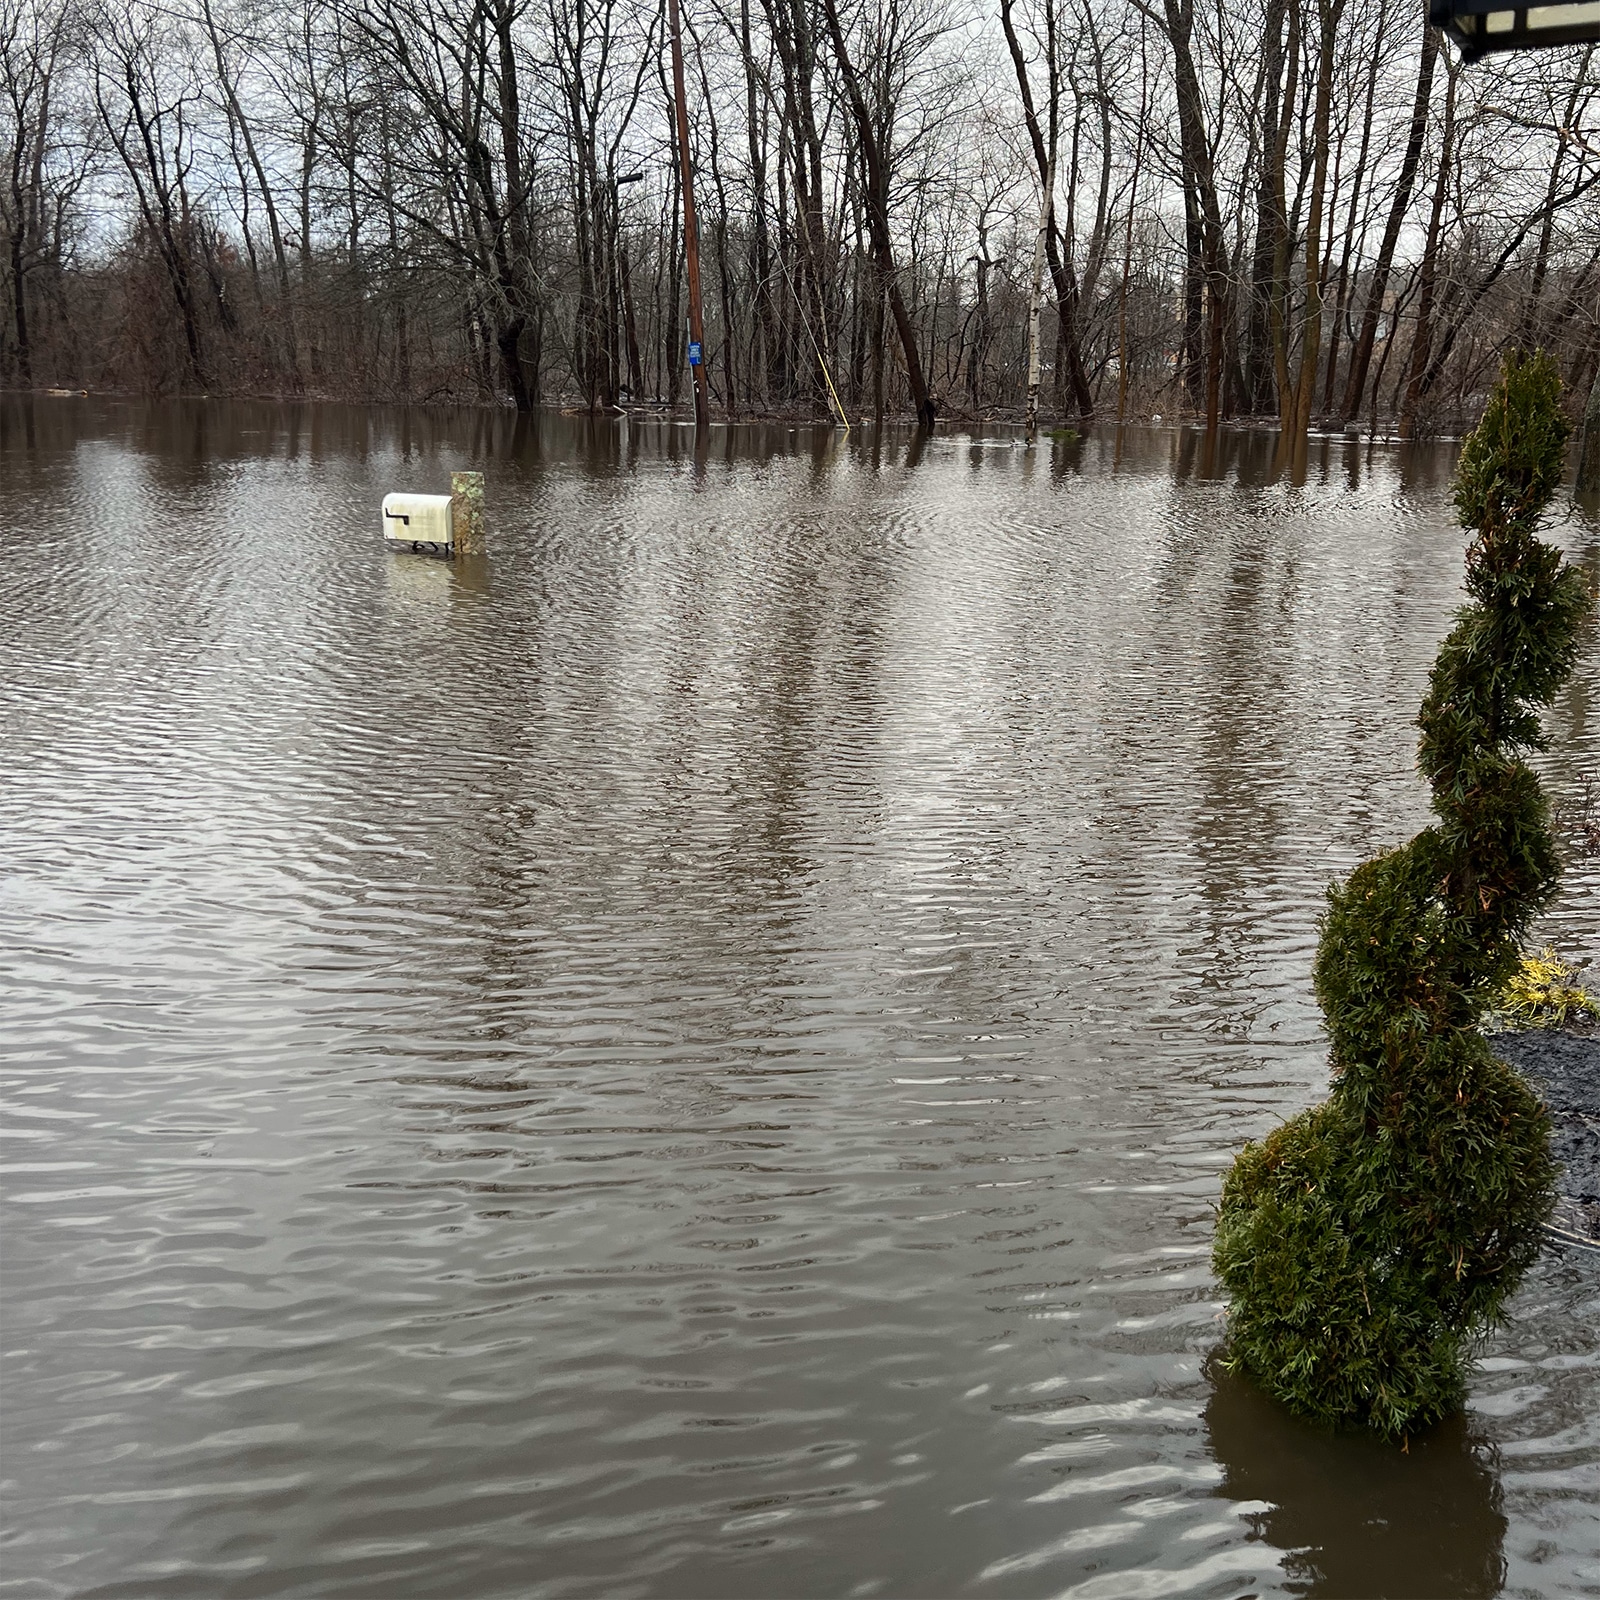
The latest unnamed storm — January 10, 2024 — soaked Providence with more than three inches overnight. 1 The rivers overran their banks, threatening dams in densely populated areas. Around the state, there were submerged roads, sinkholes; people were evacuated by boats and Humvees. And as those rivers emptied into the bay, the high tides spilled into streets and homes.
The climate models expect this, of course. Extreme rainfall has been trending up for decades. Add the effects of rising seas — eleven inches since 1956 at the Newport Tide Gauge 2 — land subsidence, and increased tidal range, and a troublesome picture emerges. A 2020 report calculated that by 2050 there would be a fifteen percent increase in Rhode Island properties at substantial risk of flooding. (Projections in seven states — Louisiana, Delaware, Florida, New Jersey, South Carolina, Texas, and Maryland — were even worse.) 3
“This area used to be under a glacier,” says Emily Vogler, a landscape architect and professor at the Rhode Island School of Design. “The landscape is going to continue changing, dramatically. The issues we have are the result of humans building in vulnerable areas and expecting conditions to stay static.”
In his backyard, Armand Deluise sees the wildlife changing. There are more waterfowl, new insects. He worries that by the time his children reach his age, the property will be under the bay. “I’ve worked hard all my life to be able to leave my kids something. I leave my kids these houses. — Well, I worry about that.”

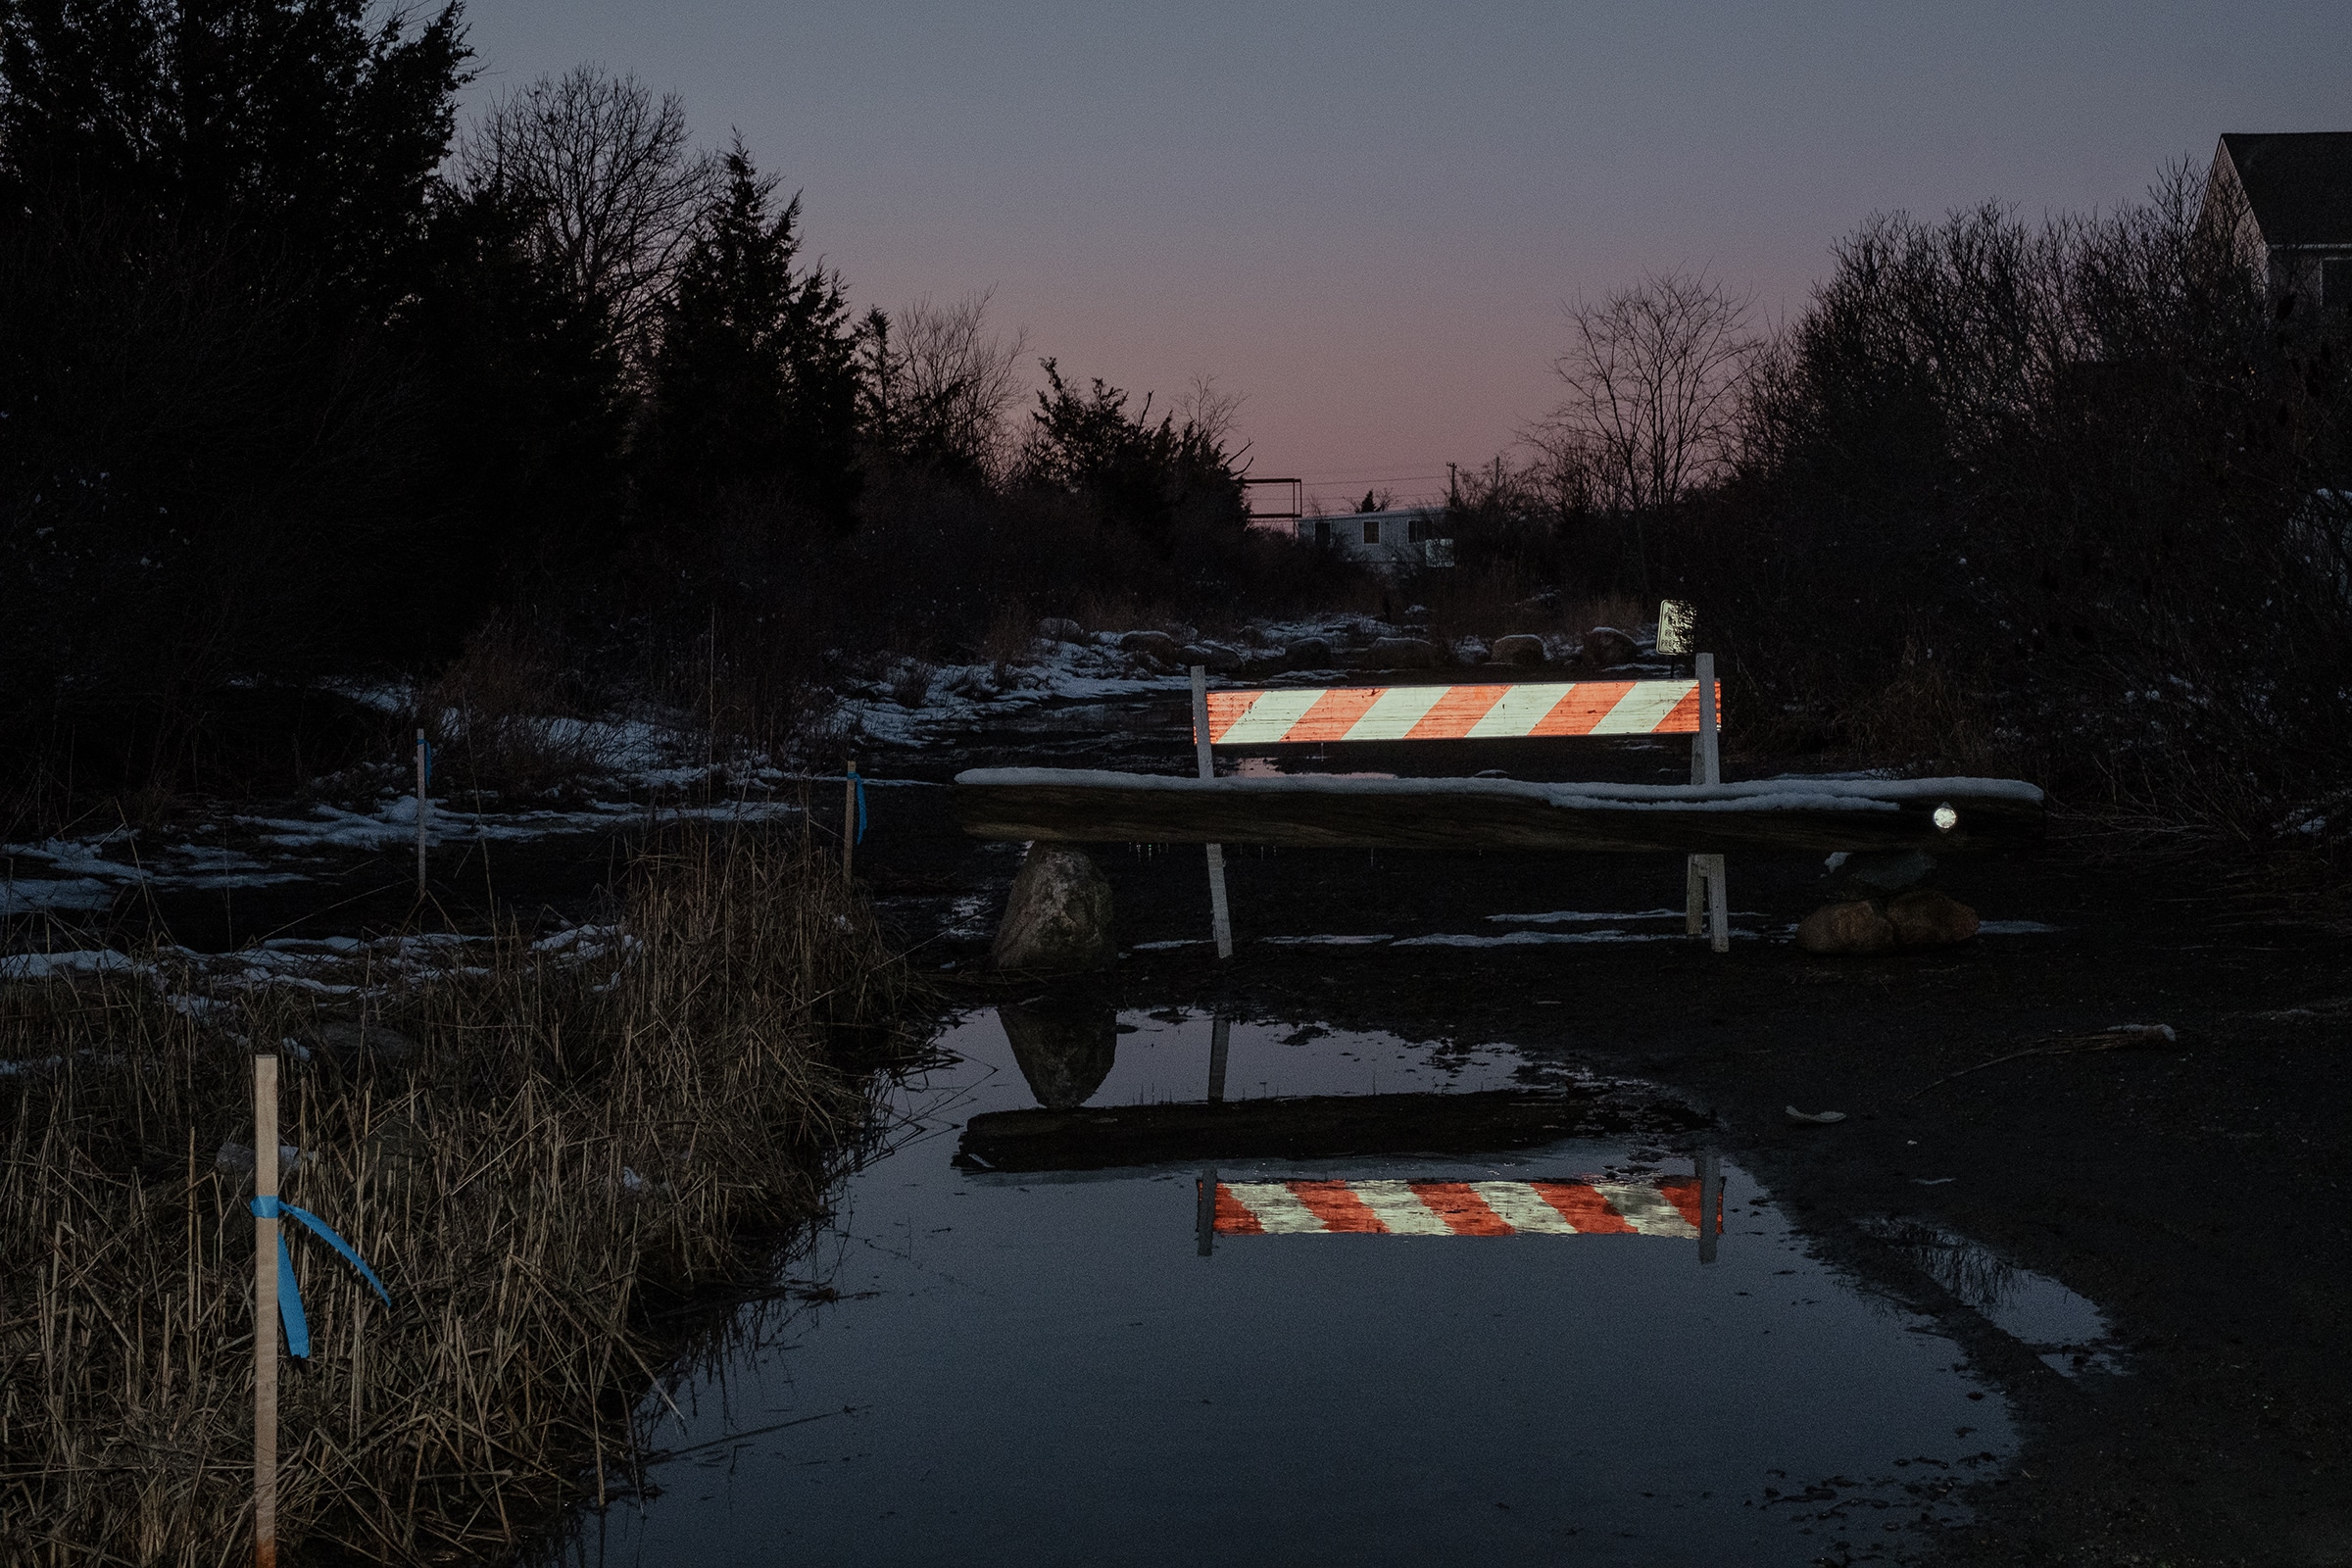
John Lacki lives across the street, farther from the water, in a house he bought 42 years ago. He, too, notices the change in the beach at the end of the road, which is more of a concept than a real place. Spadina Avenue is crumbling into the sand, and the upper beach is mostly asphalt chunks. Local conservation groups have been working on road ends like this, where storm waters and high tides have sucked the ground out from underneath. They’re installing swales with native grasses. But around here nearly every cross street falls into the bay. “I’m not worried right now,” Lacki says, “but in ten, fifteen years, these houses are going to be in trouble.” In the short term, he is staying put. “I’ll get out when the time is right.”
Deluise doesn’t want to leave either. “I wake up and see the sunrise. At night it’s like being on a ship. Quiet, dark.” From his backyard, he can point to the houses of his sister, brother, and cousins. He remembers being a kid, playing with toy cars in the middle of the street. His 1940s Cape house is clothed with an above-ground pool on one side and porches of various sorts on the others. It’s a house to be lived in, not sold. Yet “every day real estate agents call me, wanting to buy my property,” Deluise says. “I get aggravated.”
Most people don’t care about flood risk. … In a lot of cases, people just are desperate to find housing.
Brian DuPont, a Warwick realtor, has sold plenty of homes like it in the past four decades. “If people find a place on the water that’s in their price range, they’ll make a move,” he says. That goes for everything: small lots, vacant parcels, older homes. “On Conimicut Point, these very small homes have been bought up, knocked down, and rebuilt brand new.”
Buyers dream of waking up to the water, and they’ll do what they need to do to make it happen. “Most people don’t care about flood risk,” says Juli McIntosh, a listing agent for nearby homes, including one sold last spring that faces the same inlet as Deluise’s house. “We always look to see if something is in a flood zone, but in a lot of cases, people just are desperate to find housing.”
The desperation works both ways. DuPont emphasizes that it’s not easy to know when it’s time to sell. “We’ve had these floods,” he says, “but we haven’t had a catastrophic storm. One hurricane, and you know what? For the people who say they’ll wait until the time is right, it’ll be late. They might have to take a third of the price off, or more.”
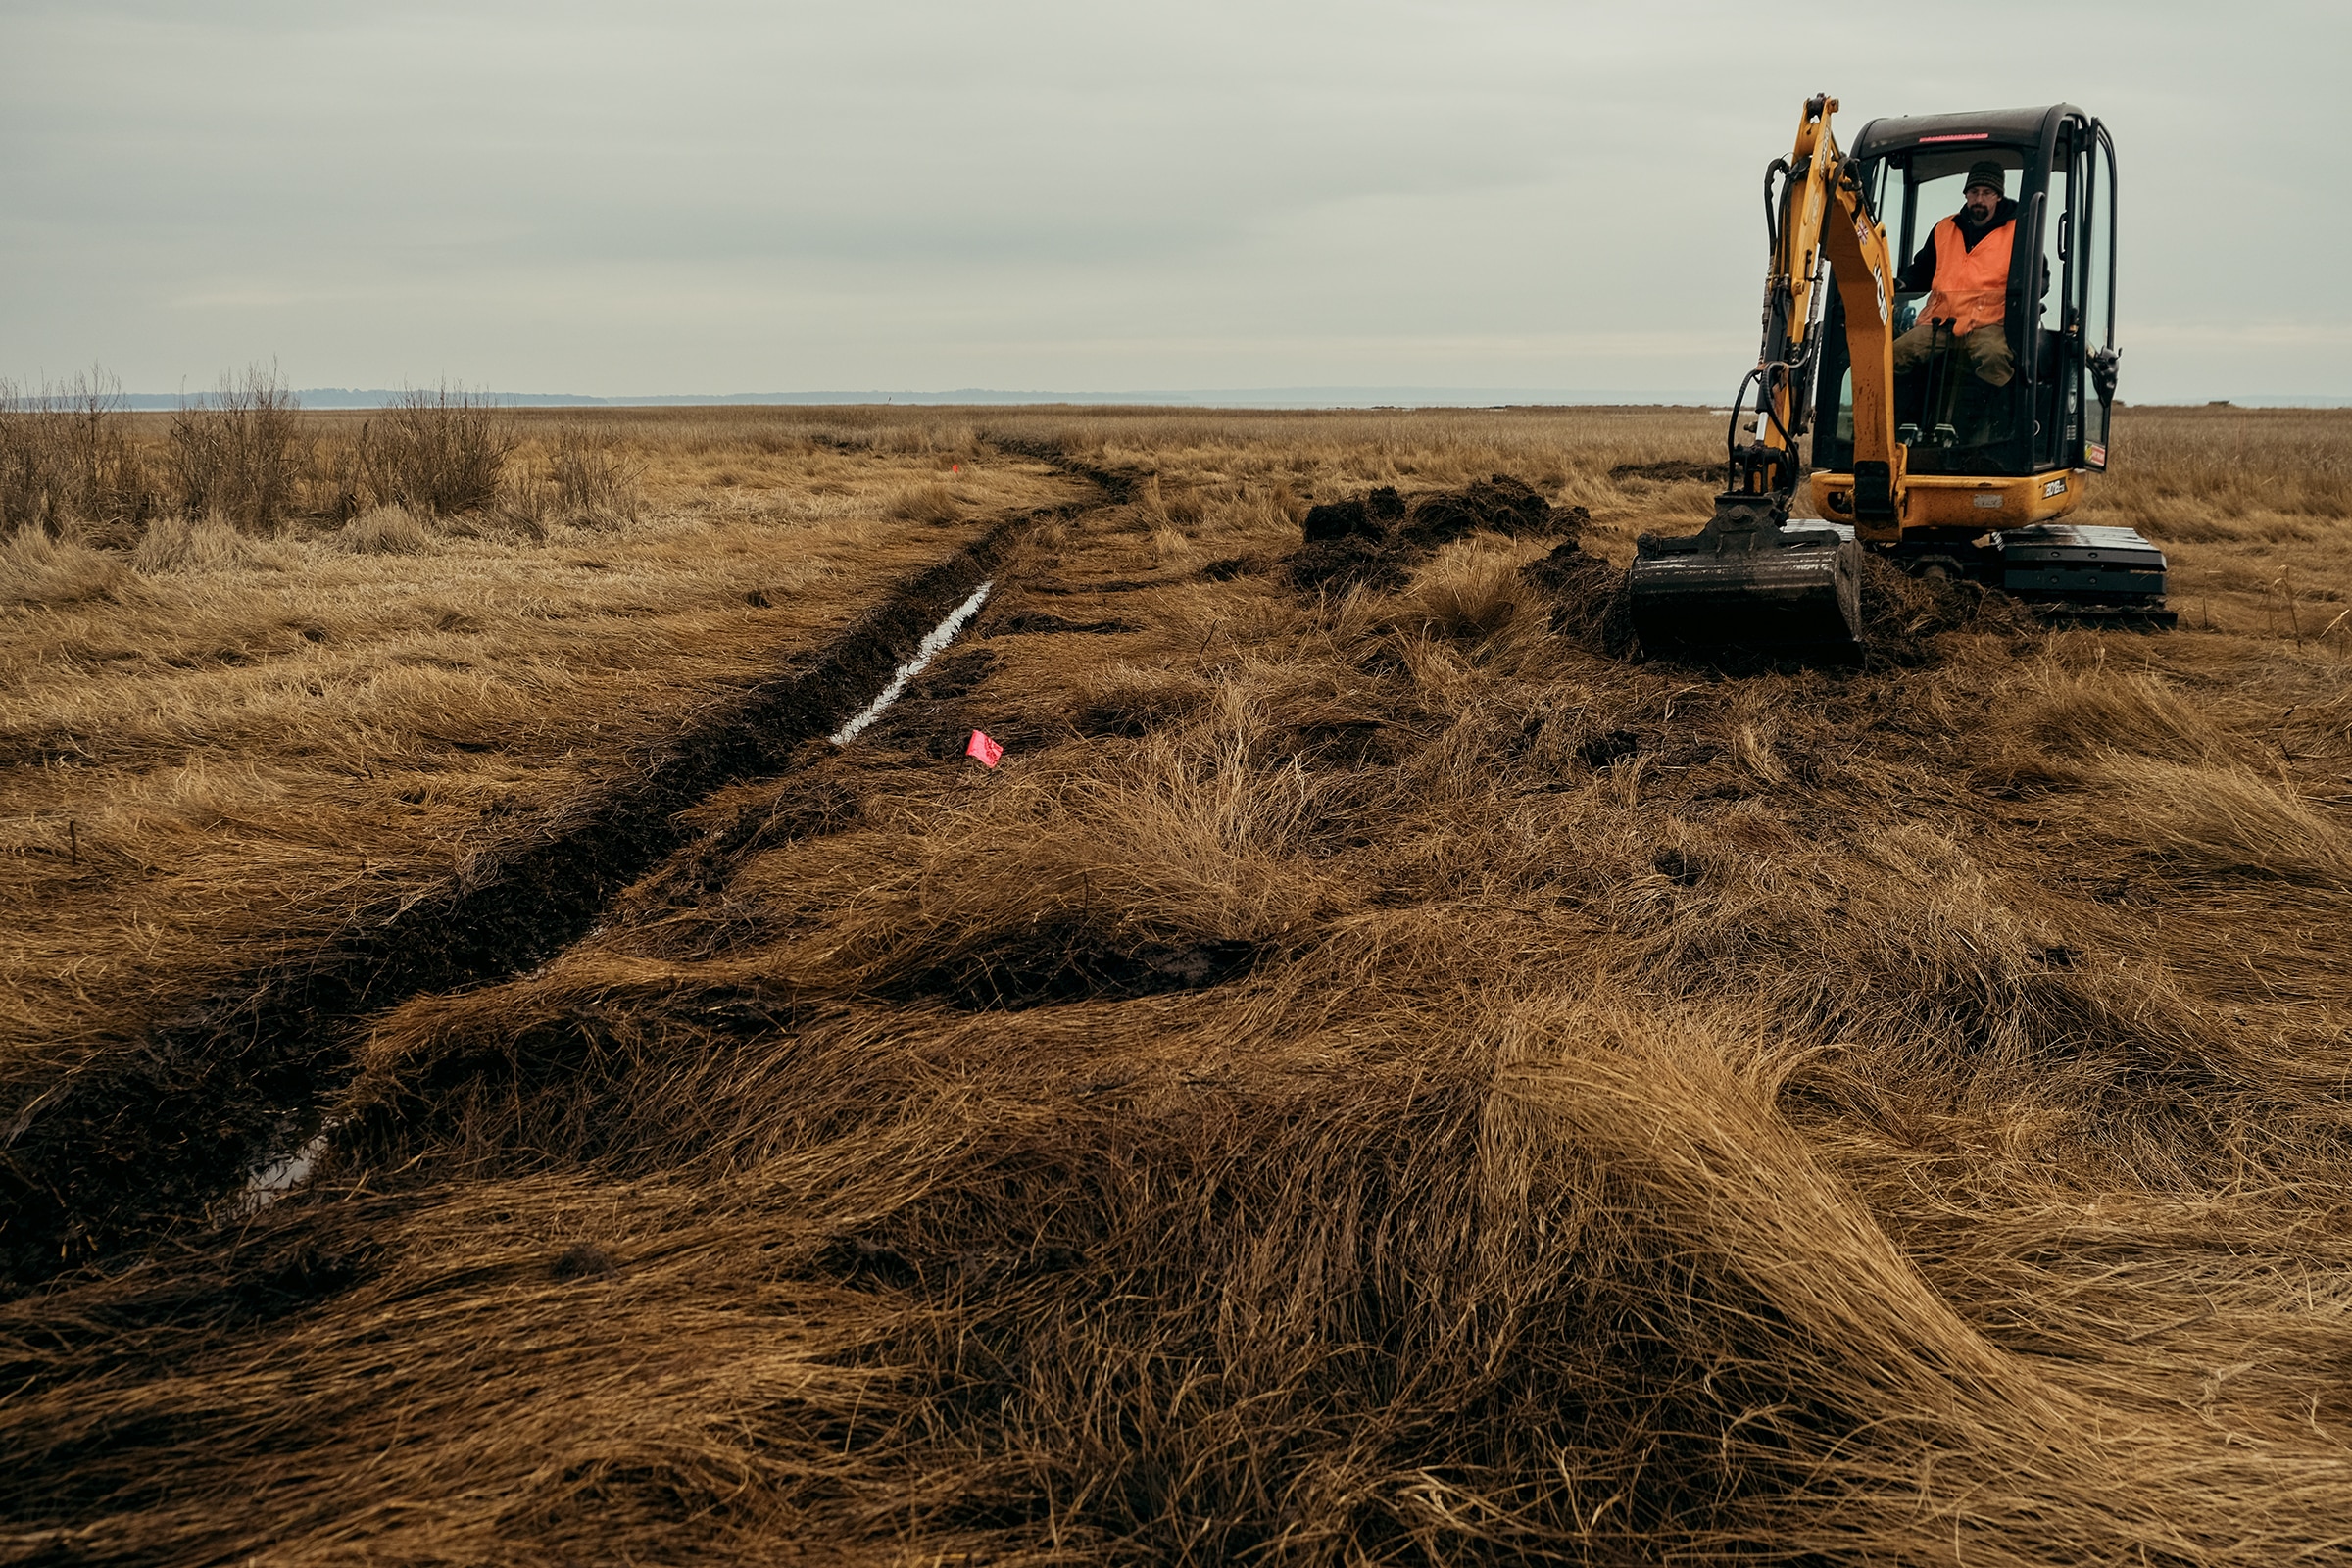

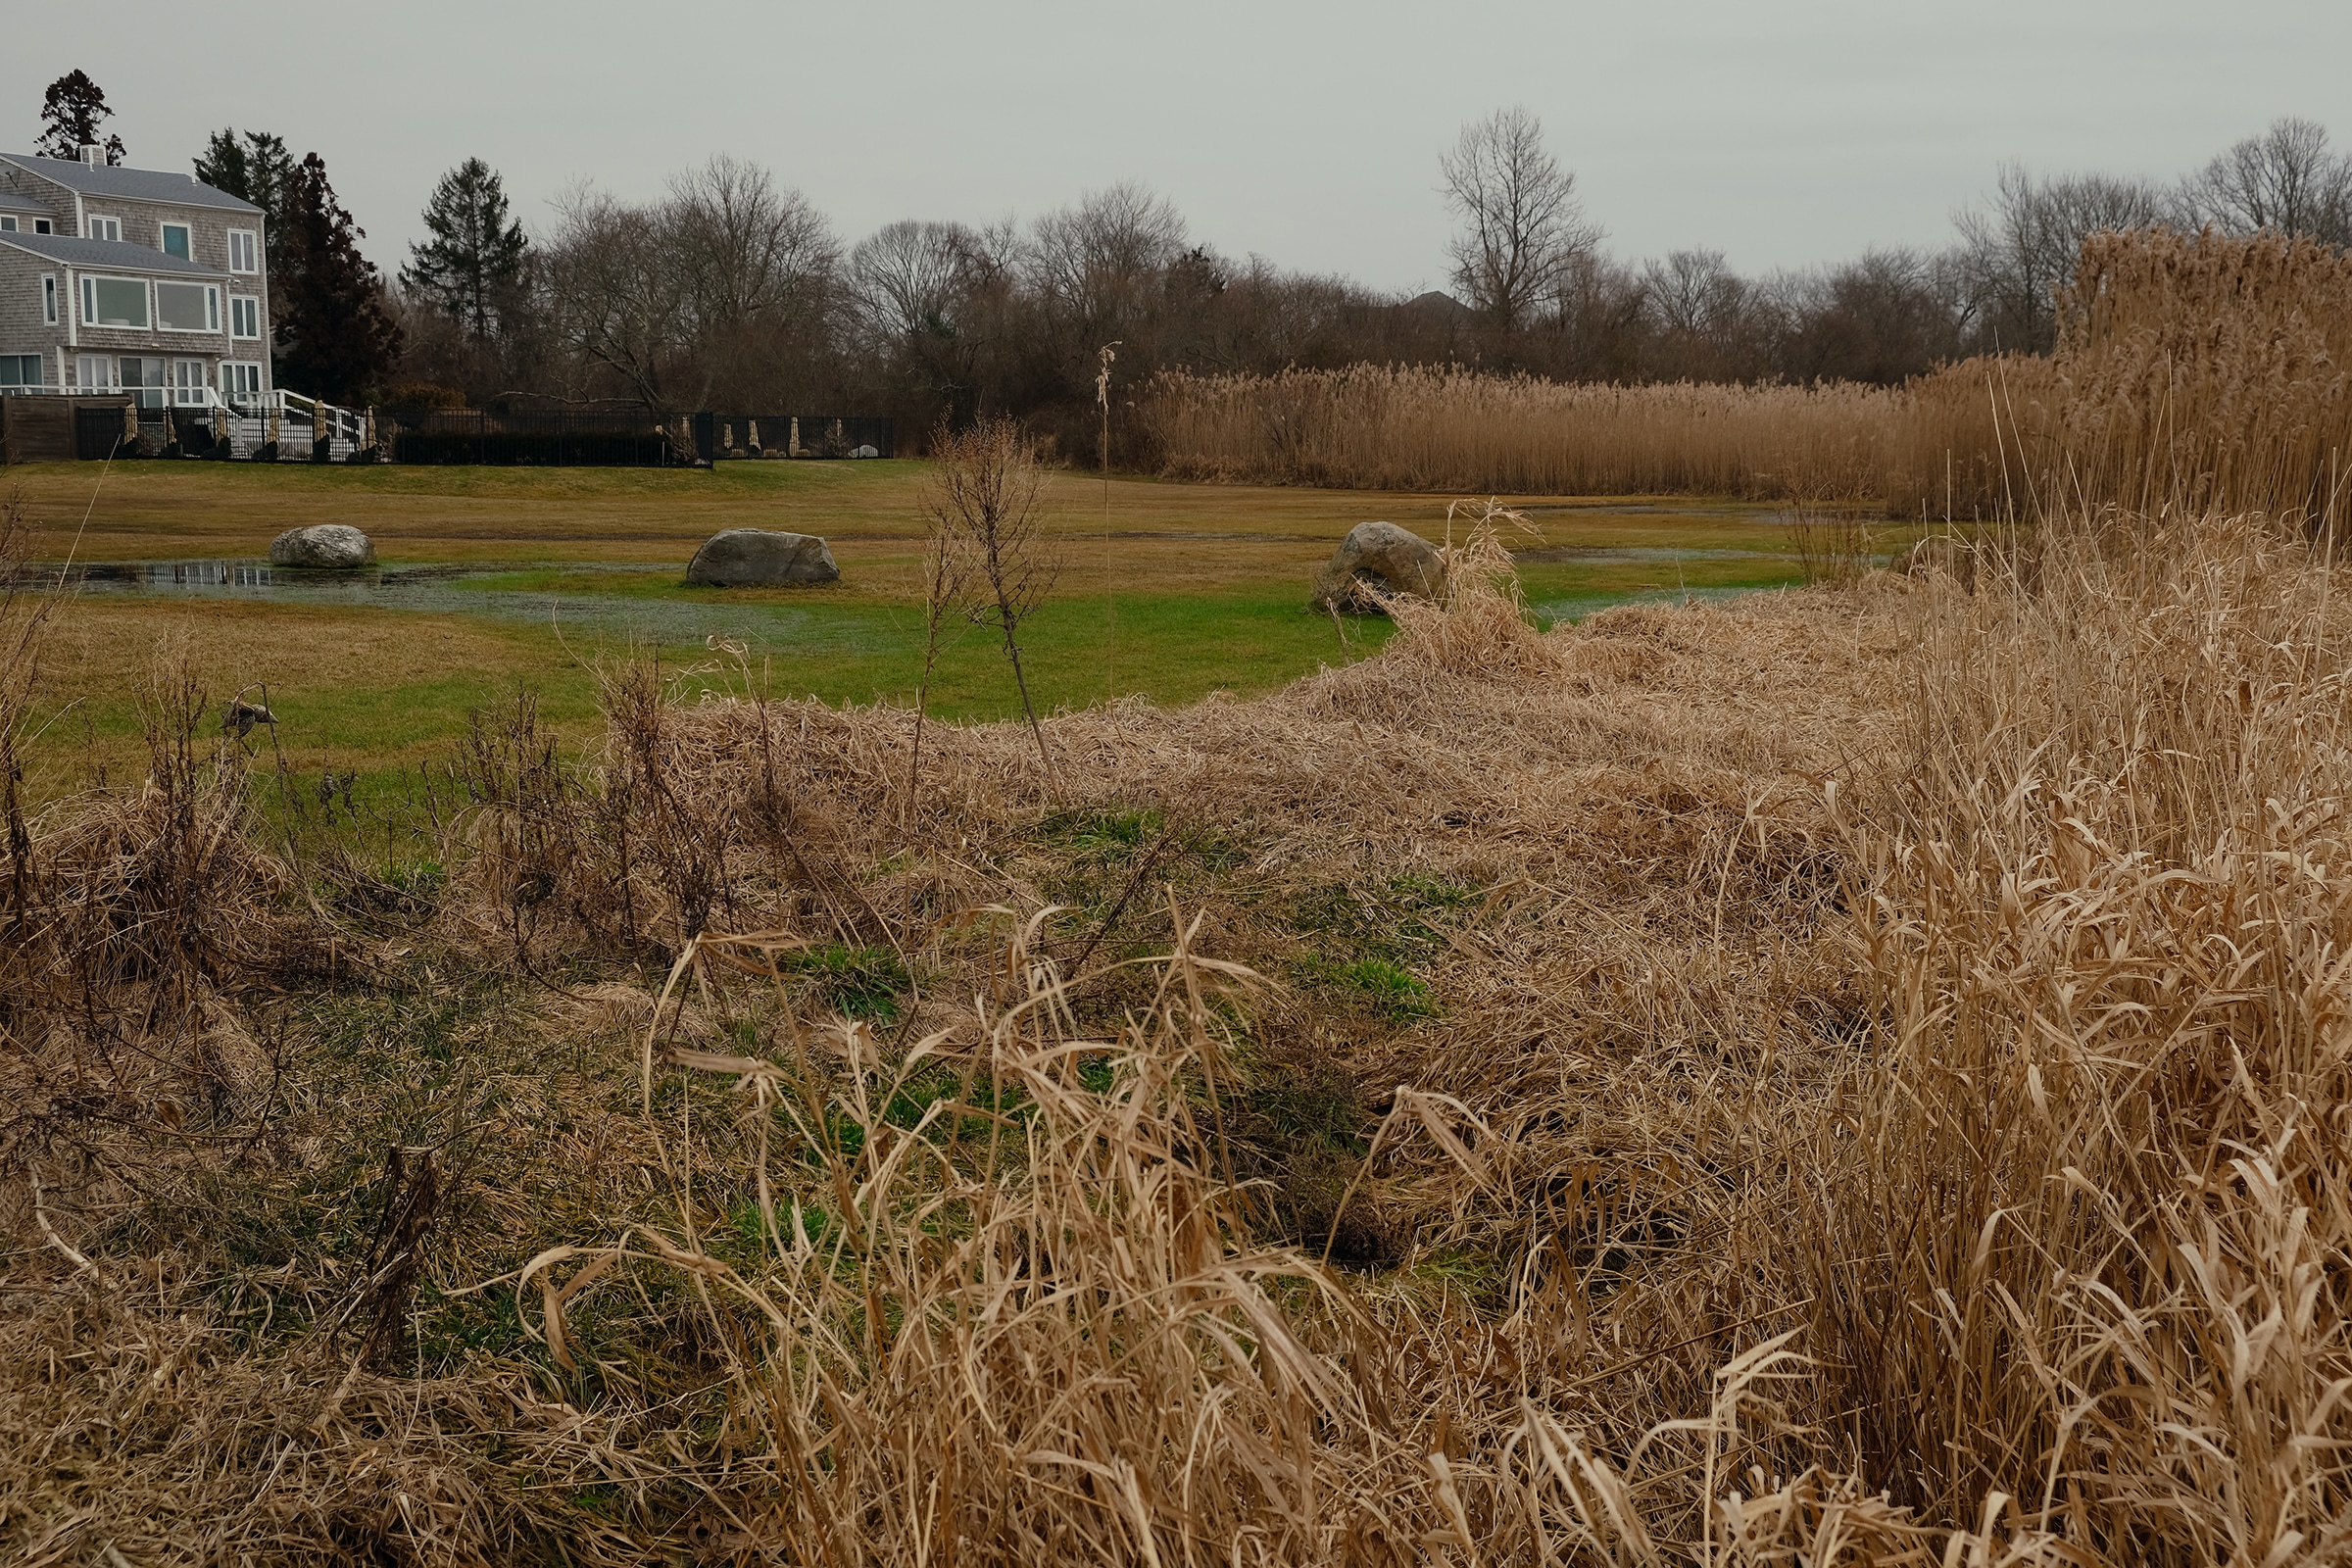
A few miles away, Ben Gaspar uses a low ground pressure excavator to restore hydrology and animal nesting sites in a marsh on Potowomut Neck. The boundaries of the wetland reserve are marked by hard lines on maps and mirrored in the world, where reeds end abruptly at mowed lawns. Homeowners have been rolling rocks uphill to mark their property. But trained eyes can see the line is an illusion.
Wenley Ferguson, who works with Gaspar at the nonprofit Save the Bay, points out the salt-tolerant vegetation that dominates the backyards, the panicum and bentgrasses whose rhizomes push in from the protected wetland. She notes the cedars, a salt-resistant species in the otherwise treeless landscape, standing sentinel on small rises. “Wetlands are migrating inland,” she says, “and they aren’t stopping for people.”
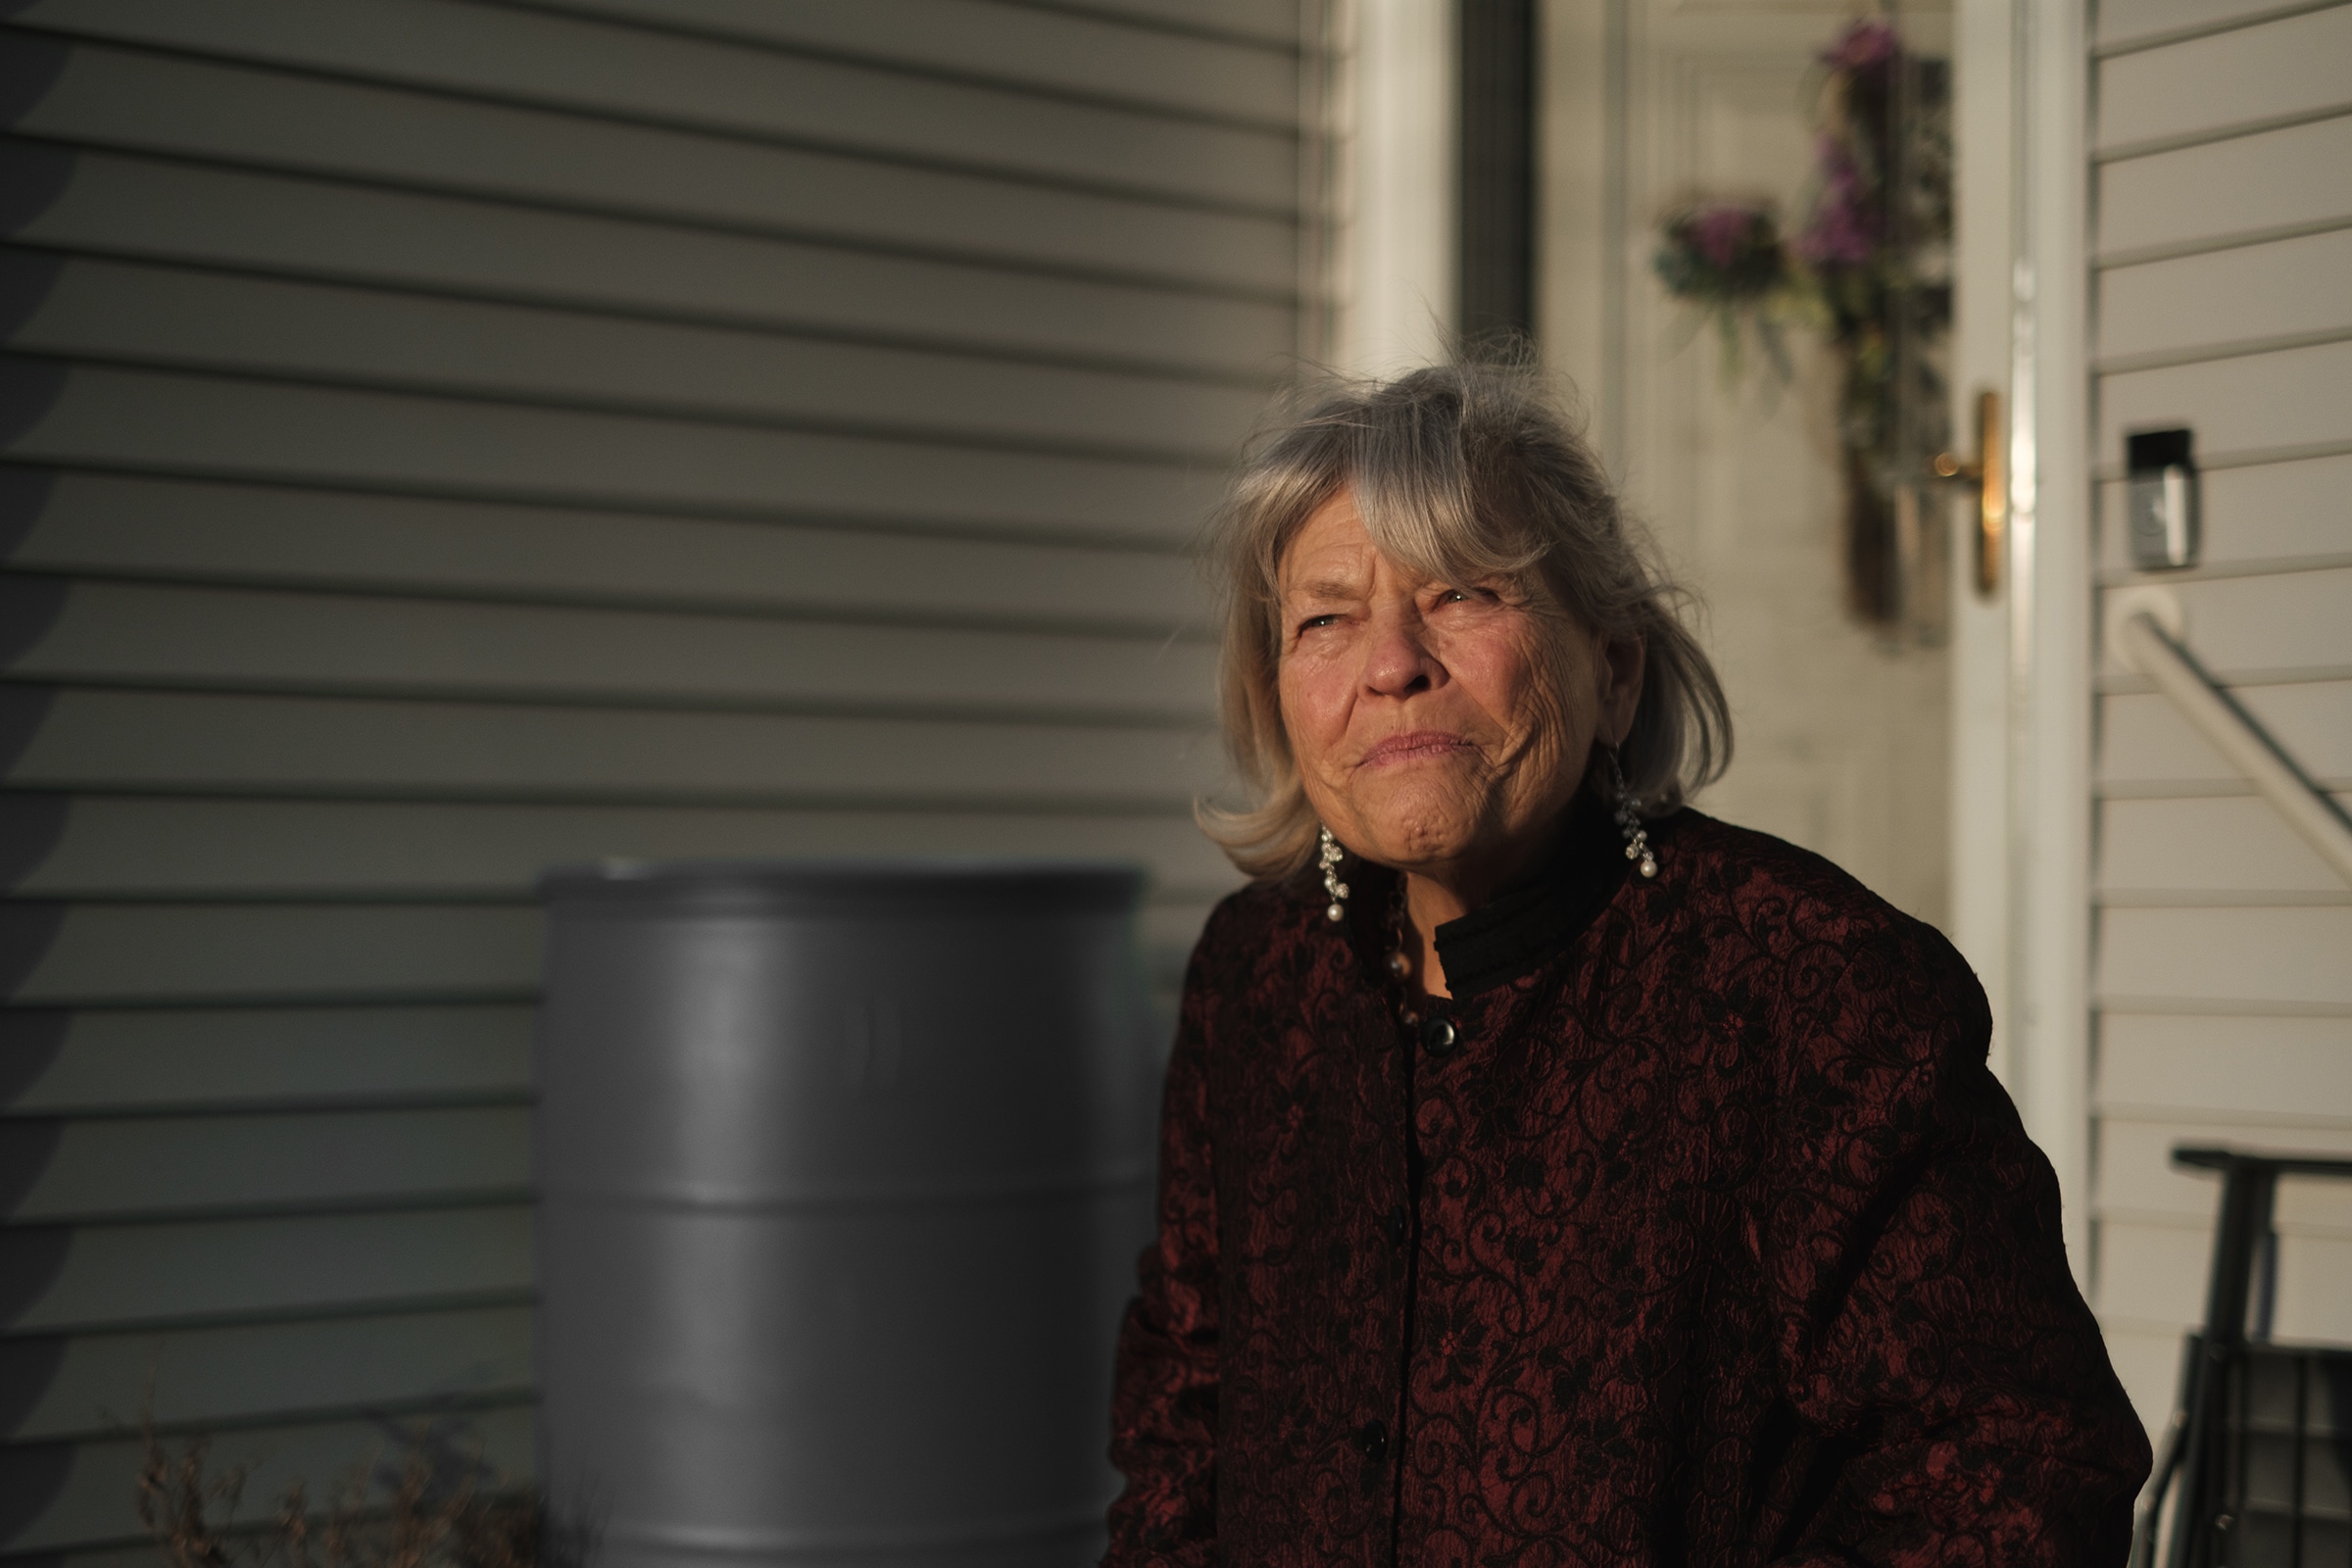
Maria Brennan is one of the owners on the high marsh. “My house was built on top of a stream,” she says. She has lived here for 57 years. Her husband was the local mail carrier. Born-again Christians, they were baptized in the ocean, and the in-laws of their daughter, a regional champion figure skater, live down the street.
Around half the houses on this stretch of road were built after Brennan moved in, low-slung ranches, many with basement windows at ground level. Her own basement flooded in 1967, taking out the furnace. Since then, it’s been one long battle. She’s having new French drains dug this year. “It’s worse than it has ever been.” Conservationists tell her all the development has contributed to the problem, because parts of the marsh that buffered her land from the sea are now paved over. But she can’t imagine moving. “This is home to me. My kids grew up here. I have no regrets.”
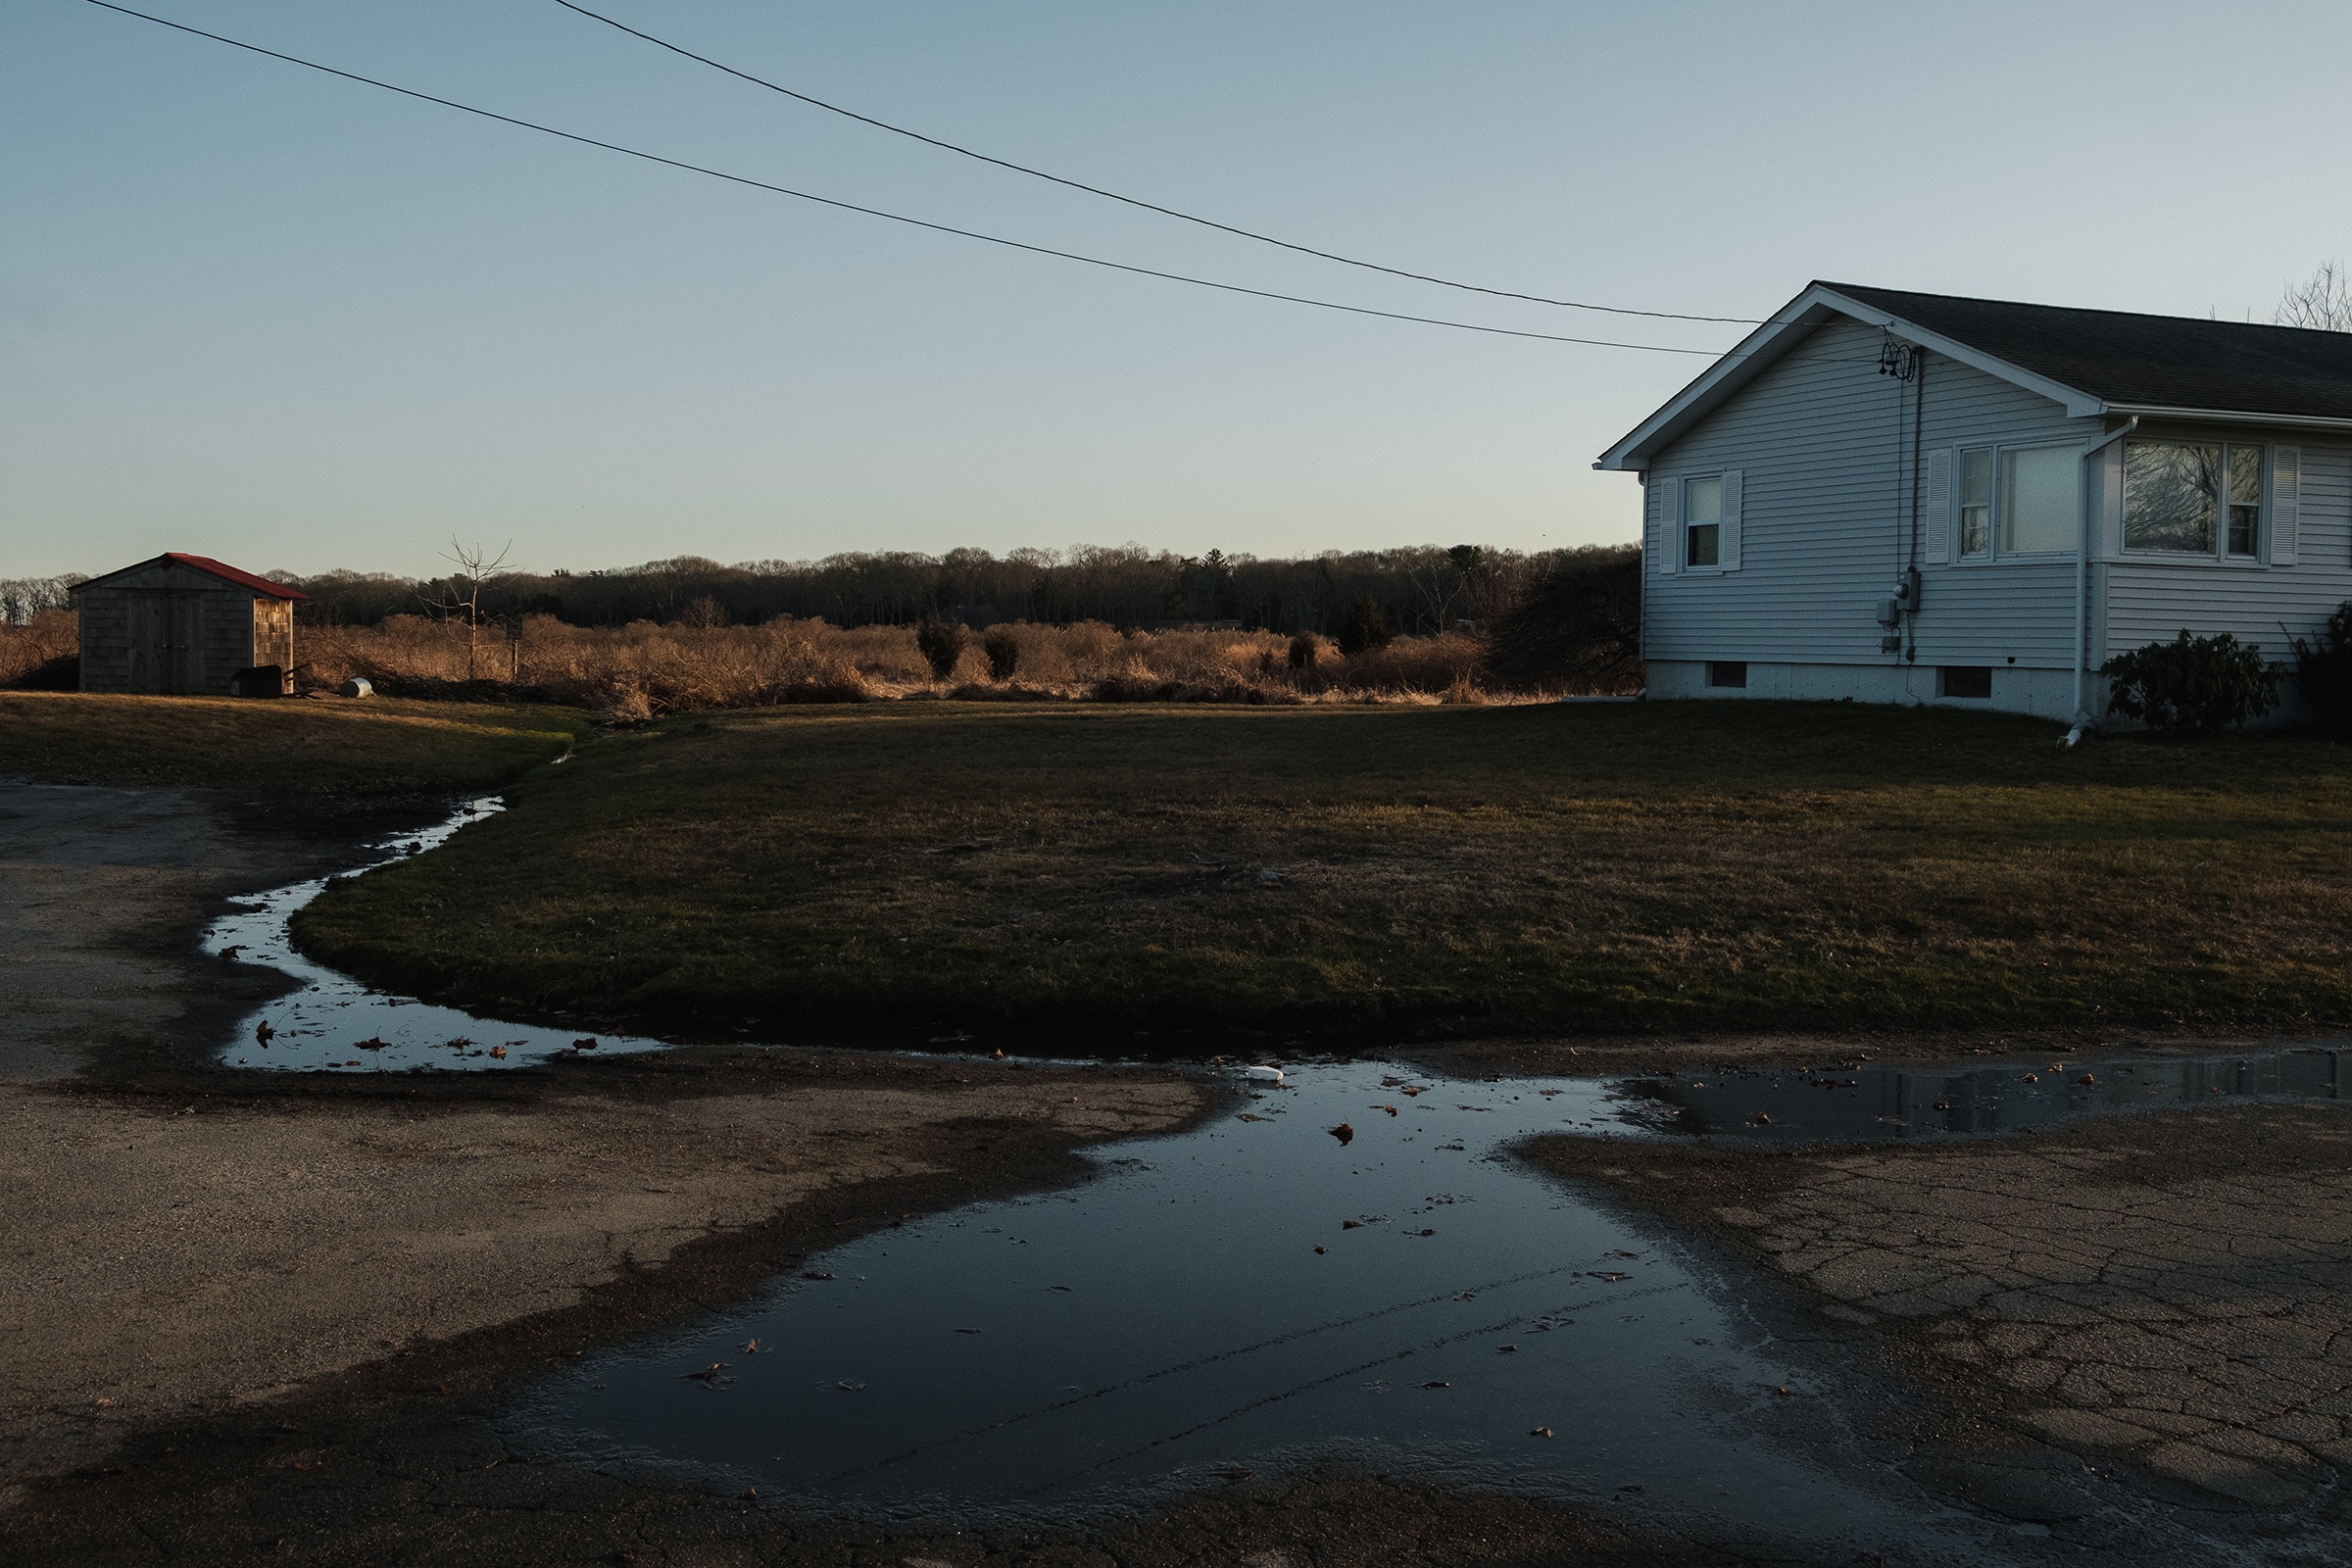
Across the street, Jane King says she’s thinking about retiring somewhere sunny. Getting out before it’s too late is part of that. “Do I worry about climate change? Absolutely.” She wonders if the warm winter will strengthen autumn storms. As it is, gurgling sump pumps are part of the neighborhood soundscape. Water that would be in the ground, seeping into basements, is pumped out to the street, where it flows to the marsh and stagnates. Then the tide sweeps it toward the houses again.
King’s and Brennan’s new drainage systems kept them dry through the heavy rains in January. But if they ever lose power, the electric pumps will stop running. Says King, “when the factors line up — rain, tide, wind — this house is in trouble.”
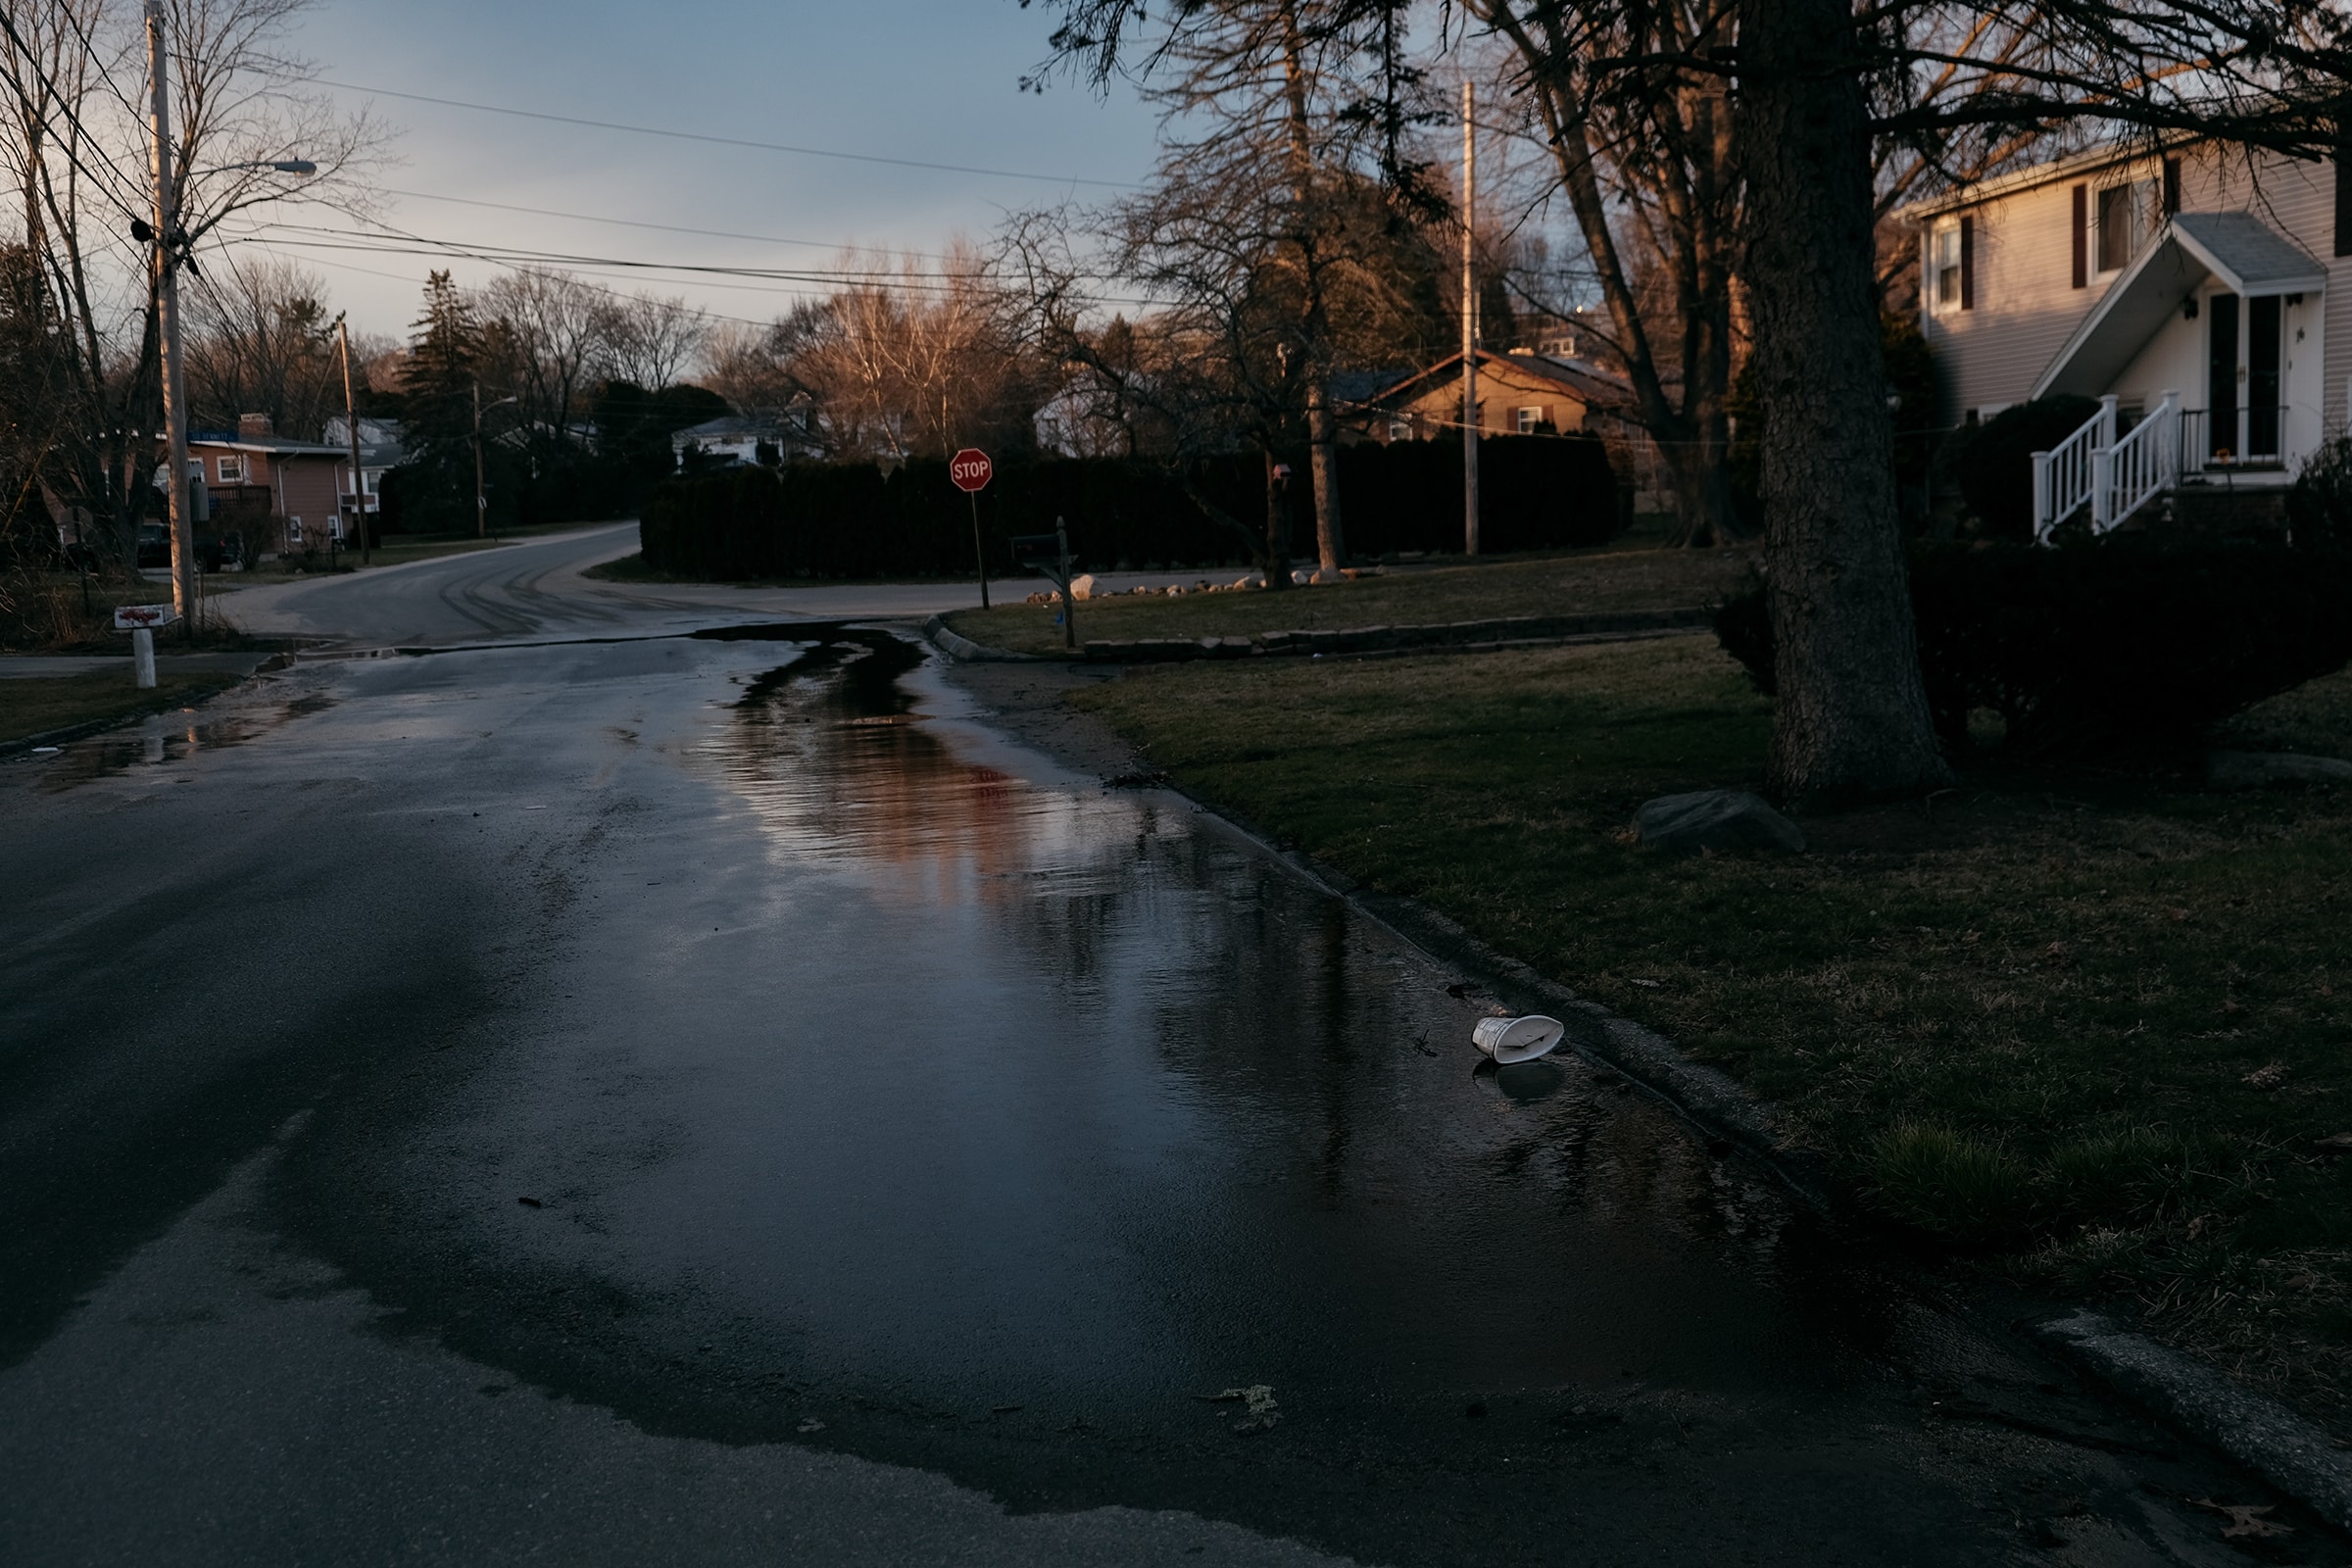
Inland communities are at risk, too. Calling the Pocasset a river is generous: it’s twelve miles long and sometimes only a few feet wide. Most of those miles are out of sight, on back lots in densely settled neighborhoods of Johnston, a traditional farming community west of Providence that has been suburbanized. The dams are left from the days when the water powered mills and irrigated fields, but now the river flows quietly behind auto dealerships, fast food places, and Price Rite stores. Johnston doesn’t look like a place that floods, but when it rains as hard as it did in January, the Pocasset rises, and River Drive disappears beneath feet of water.
If I had known I was living in the middle of a lake, I wouldn’t have moved in.
“This is a house that shouldn’t have been built,” says Edwin Piverger, standing outside the home he bought three years ago, where he lives with his wife and kids. “If I had known I was living in the middle of a lake, I wouldn’t have moved in.”
The house has a 99.9 percent chance of flooding within the next 30 years, according to data prominently displayed on Redfin and other real-estate websites. Maps published by the Federal Emergency Management Agency show that the regulatory floodway — the land allotted to the river — ends at the foundation.
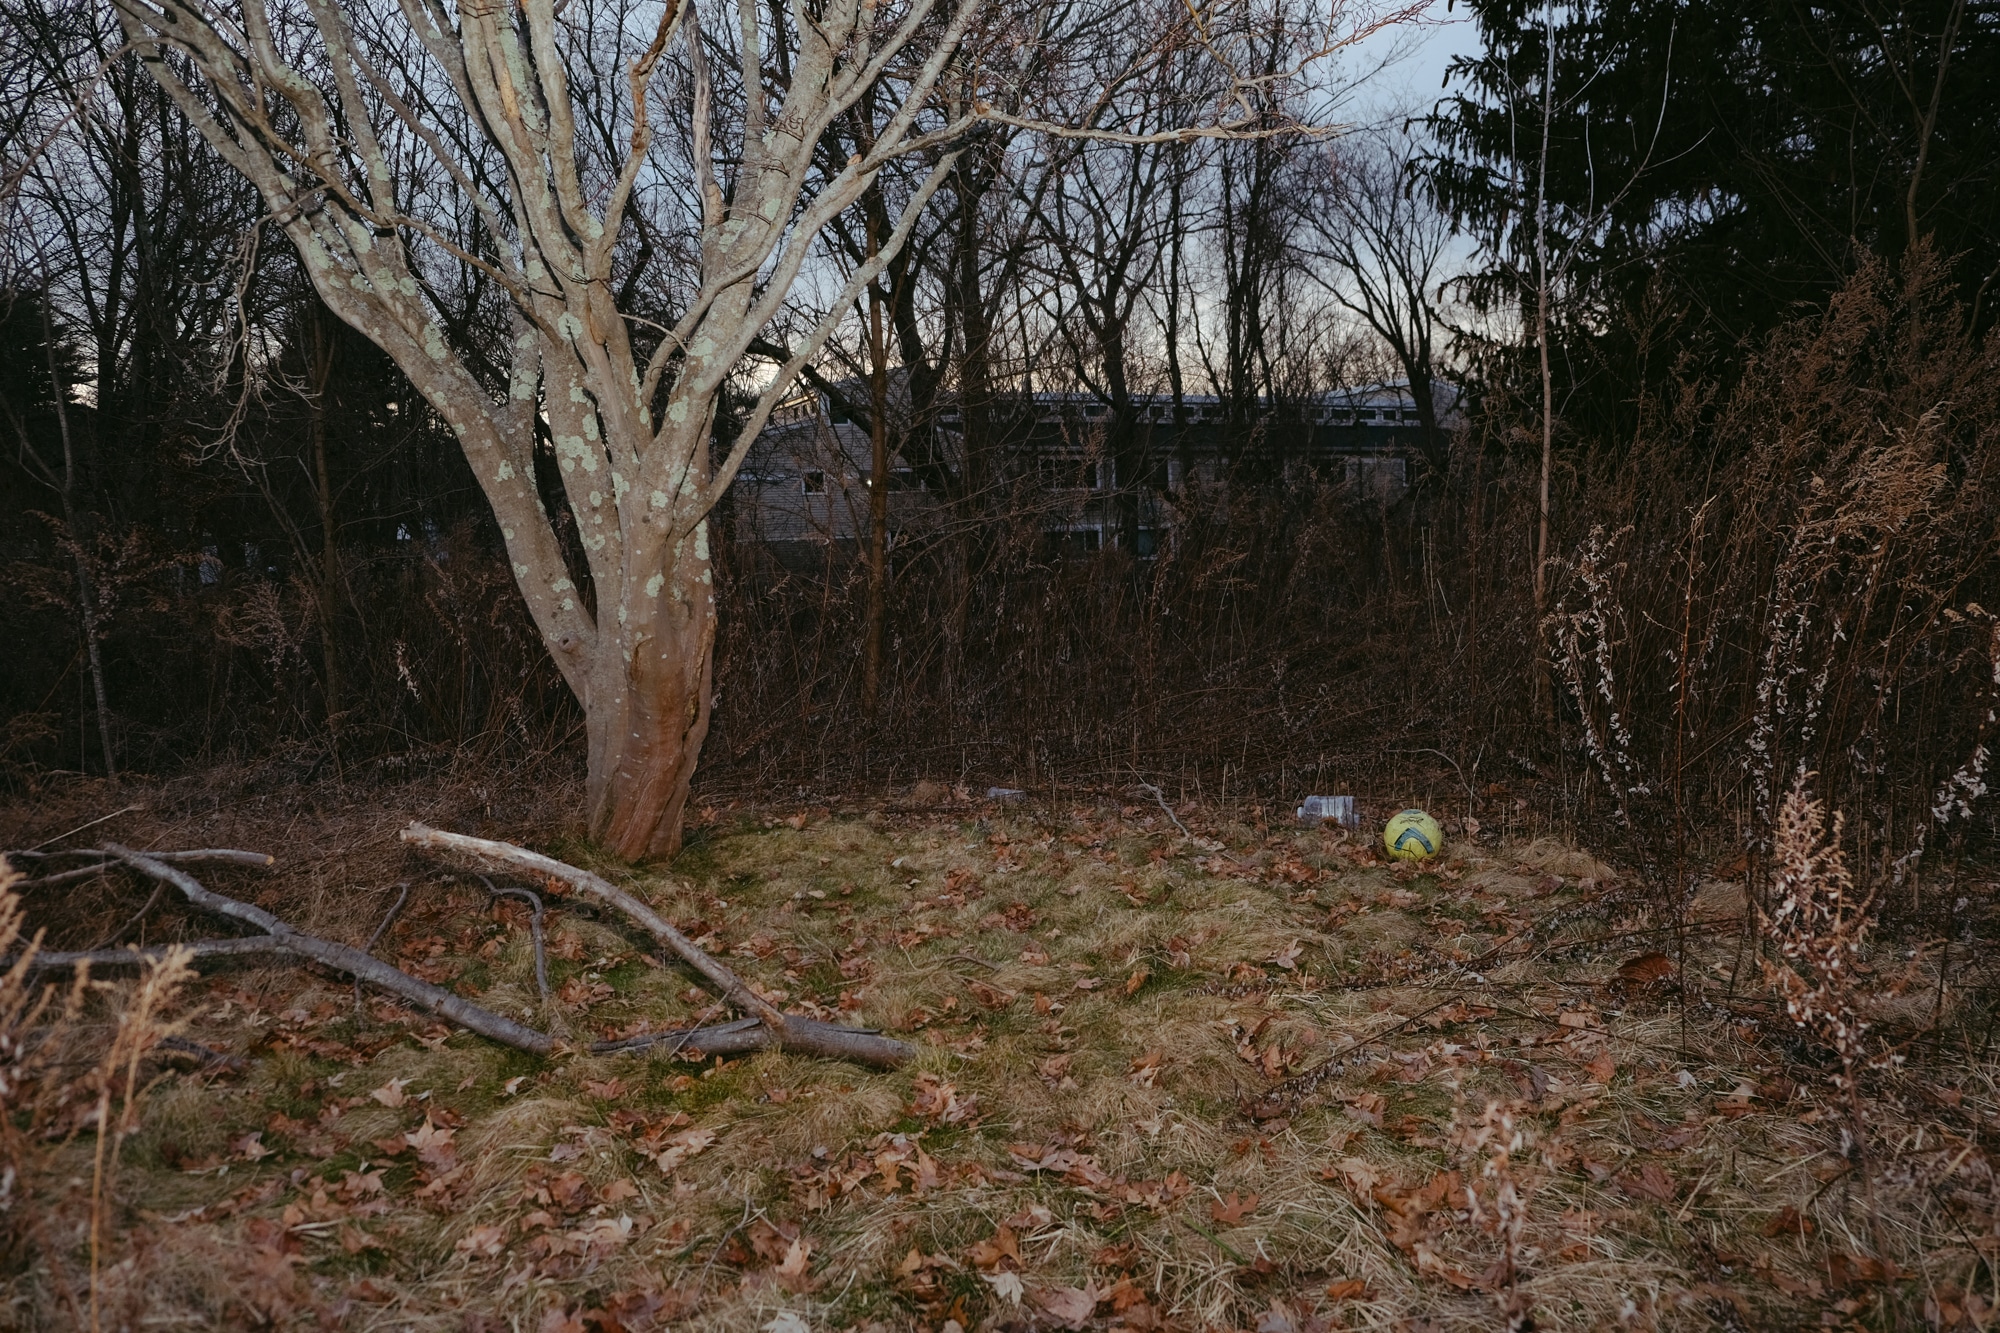
The Pivergers’ house stands alone on their side of the street, the rest of the lots overgrown with riparian brush. You wouldn’t think anything of it, unless you happened to notice the street numbers that skip from one to seventeen, leaving a gap seven houses wide. In 2011, after a year of heavy rainfall, the city won federal funding to buy and demolish those buildings. 4
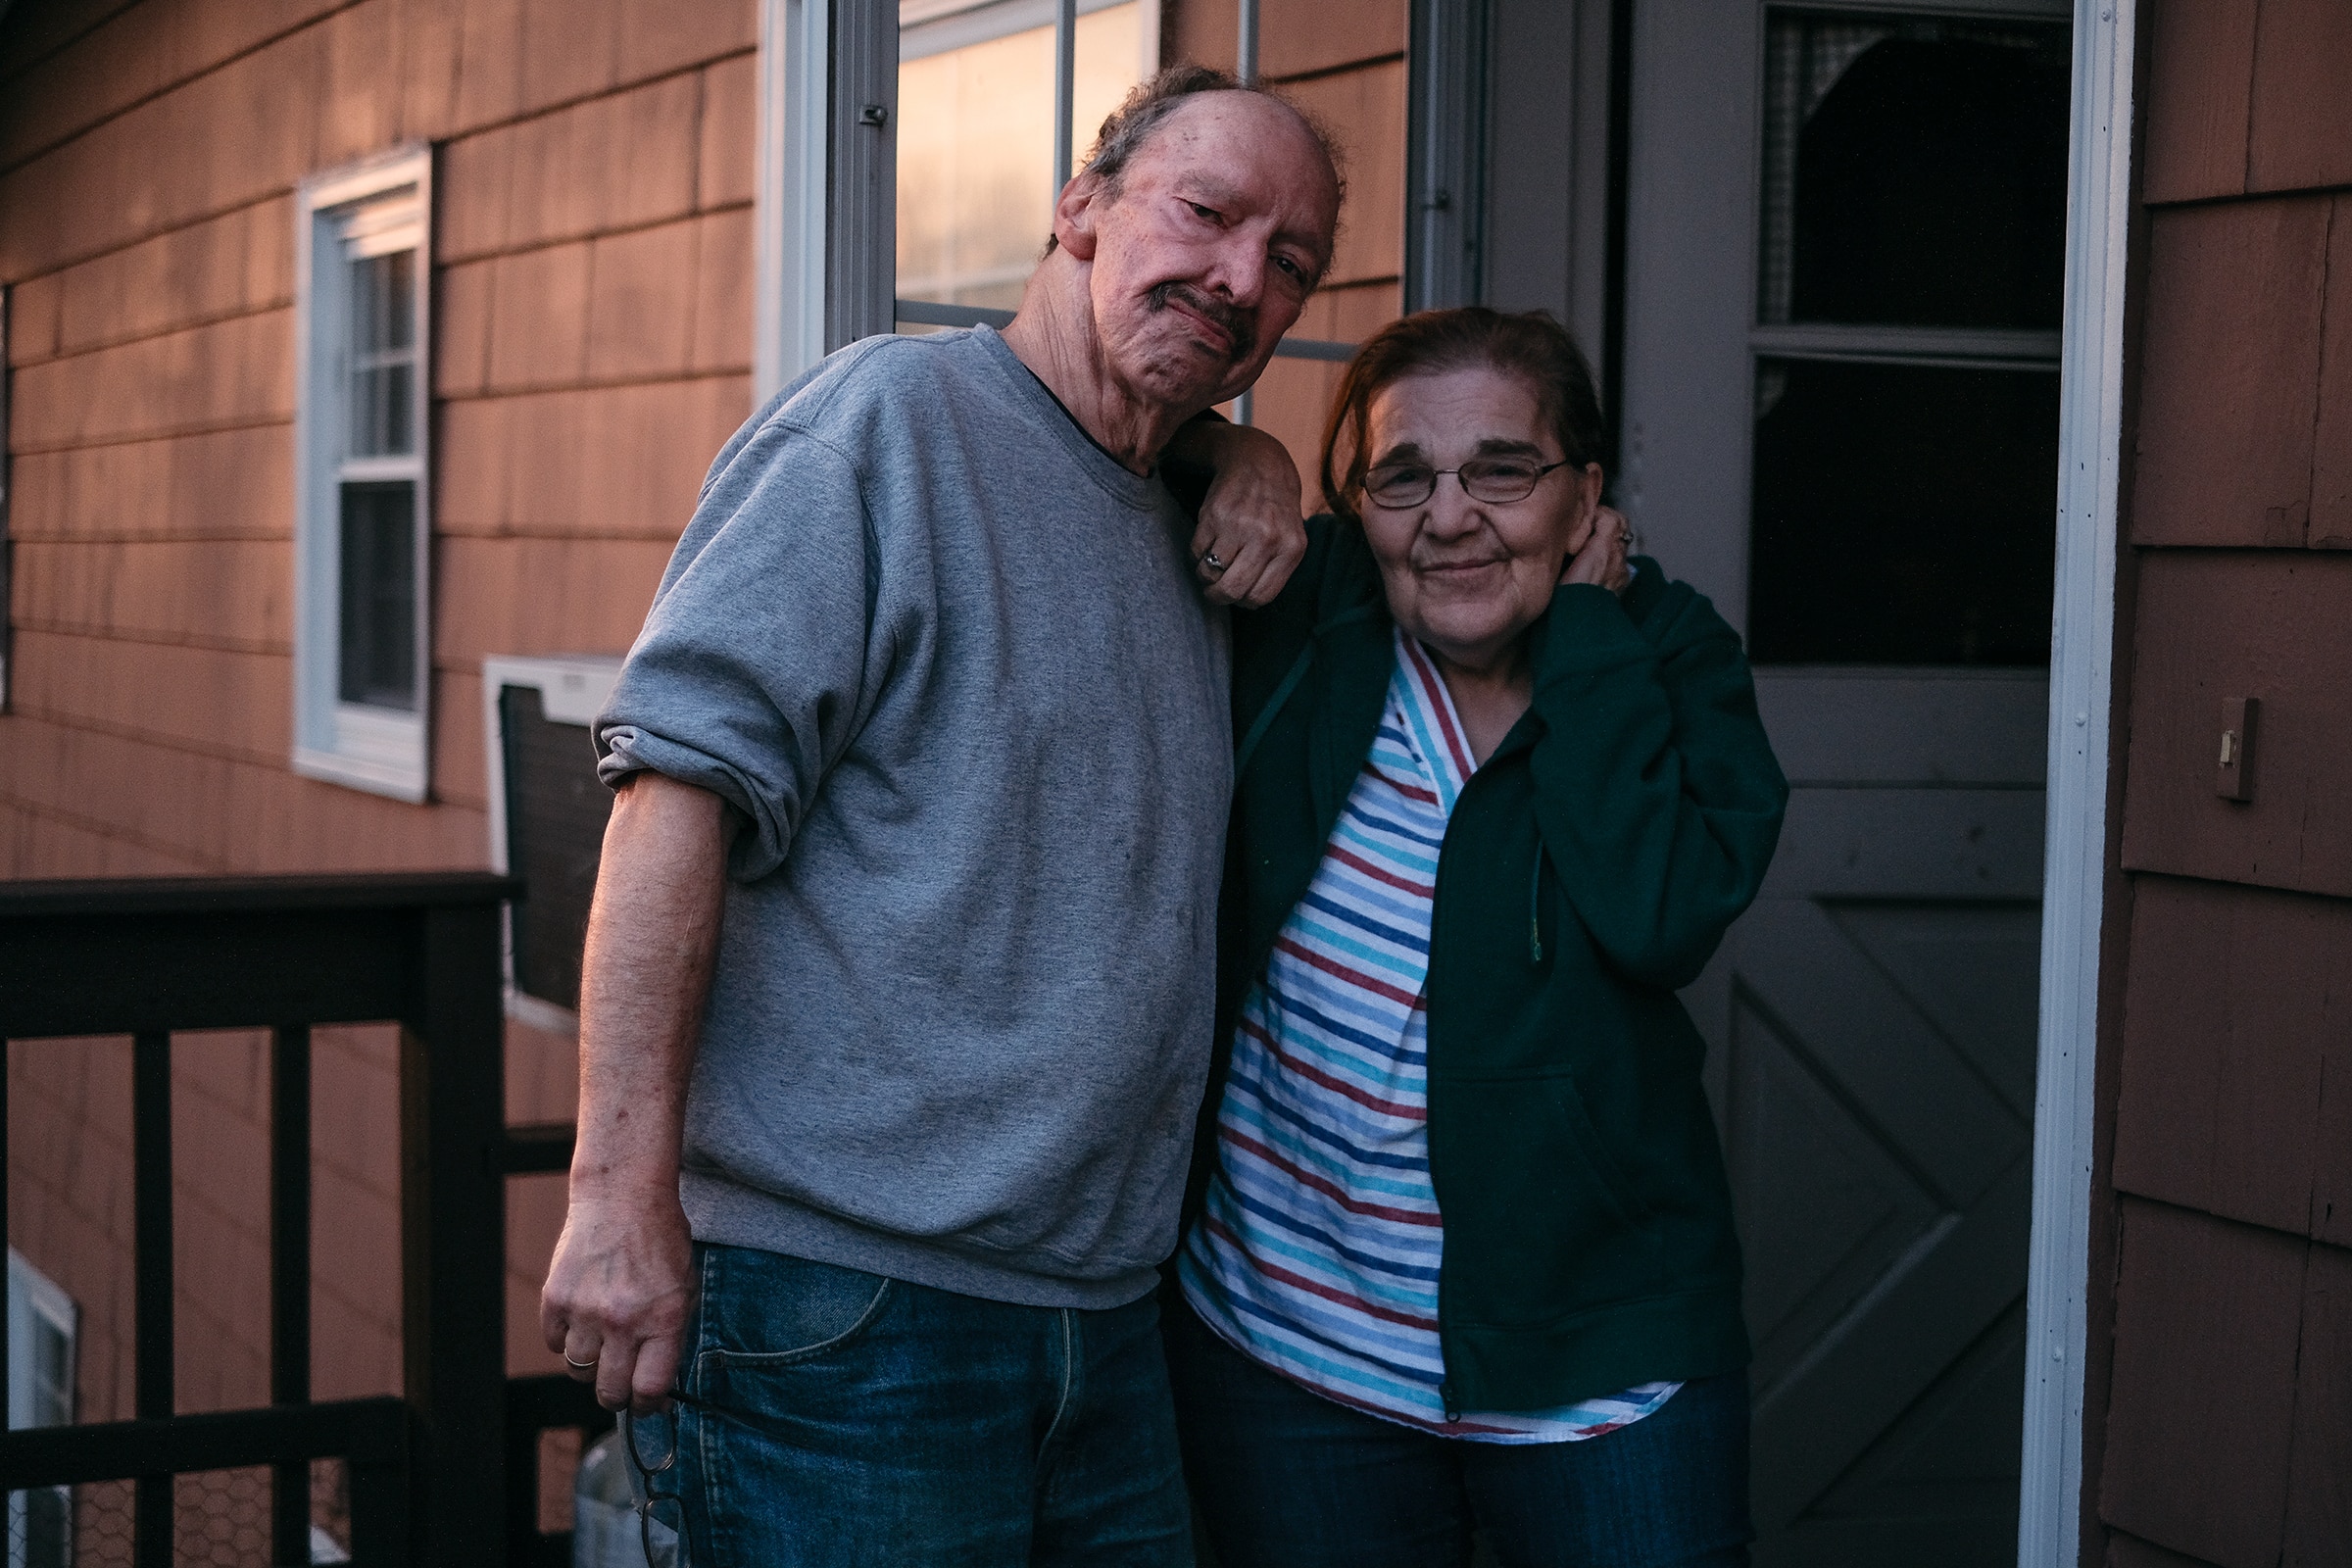
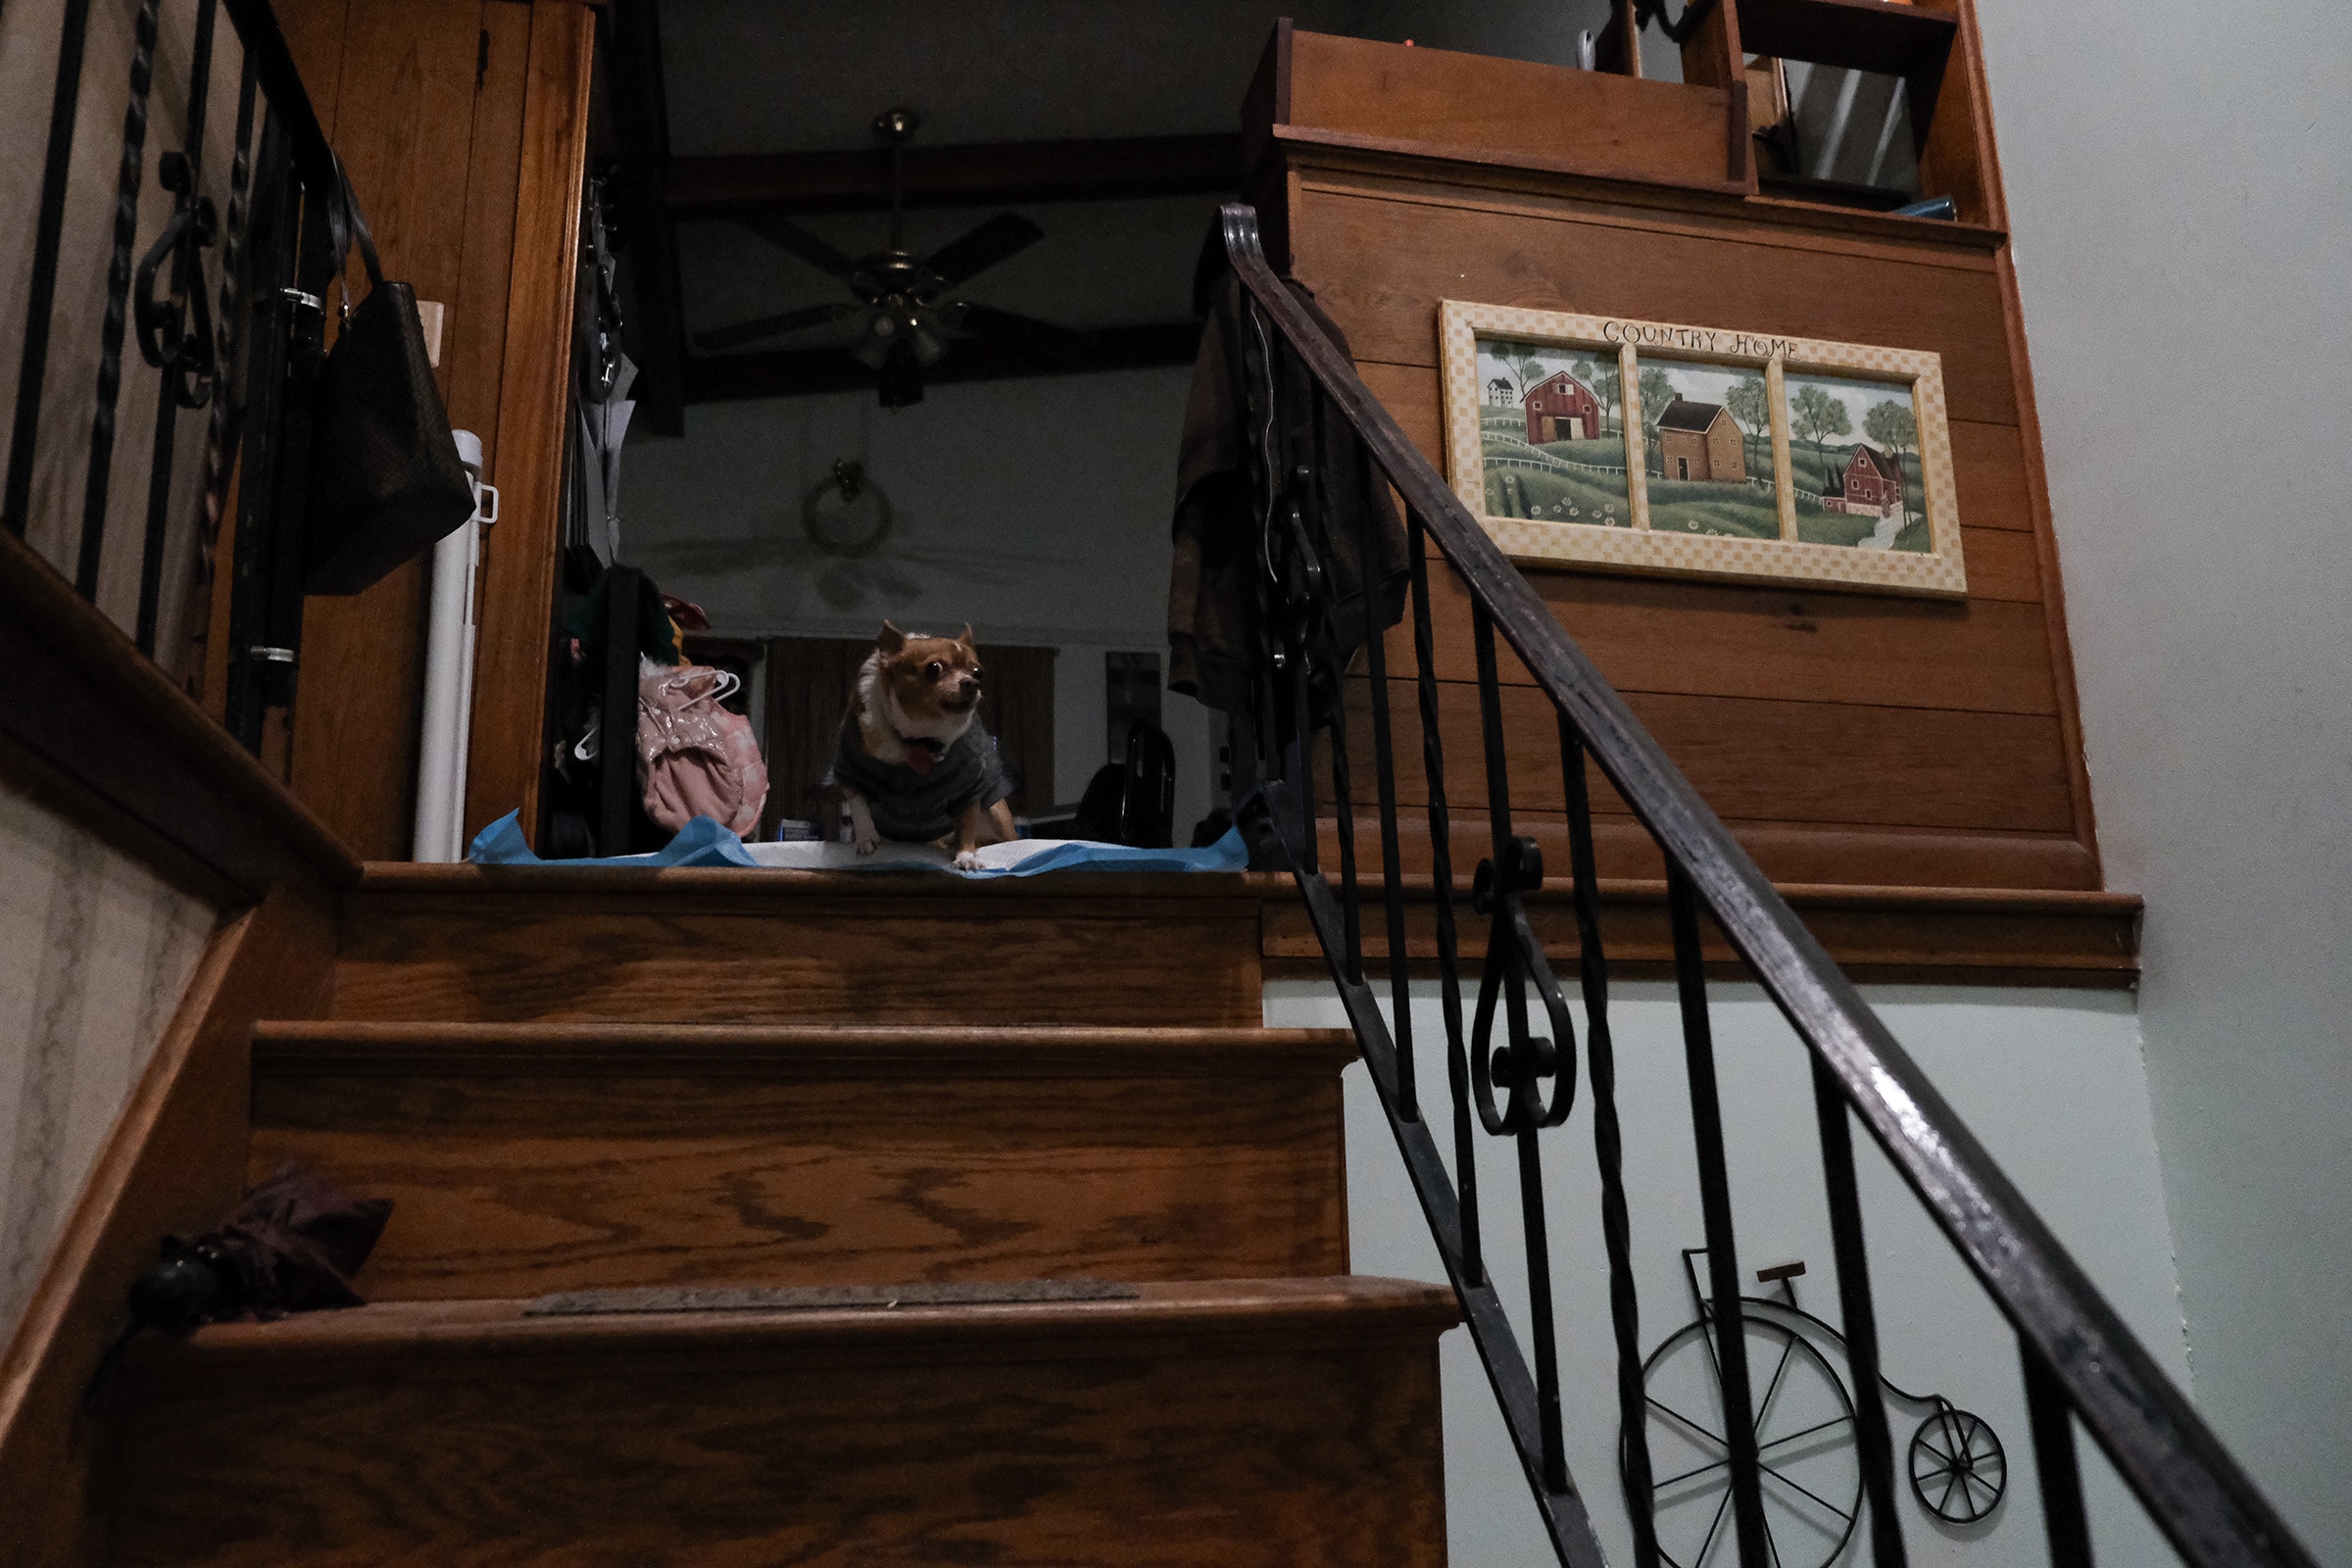
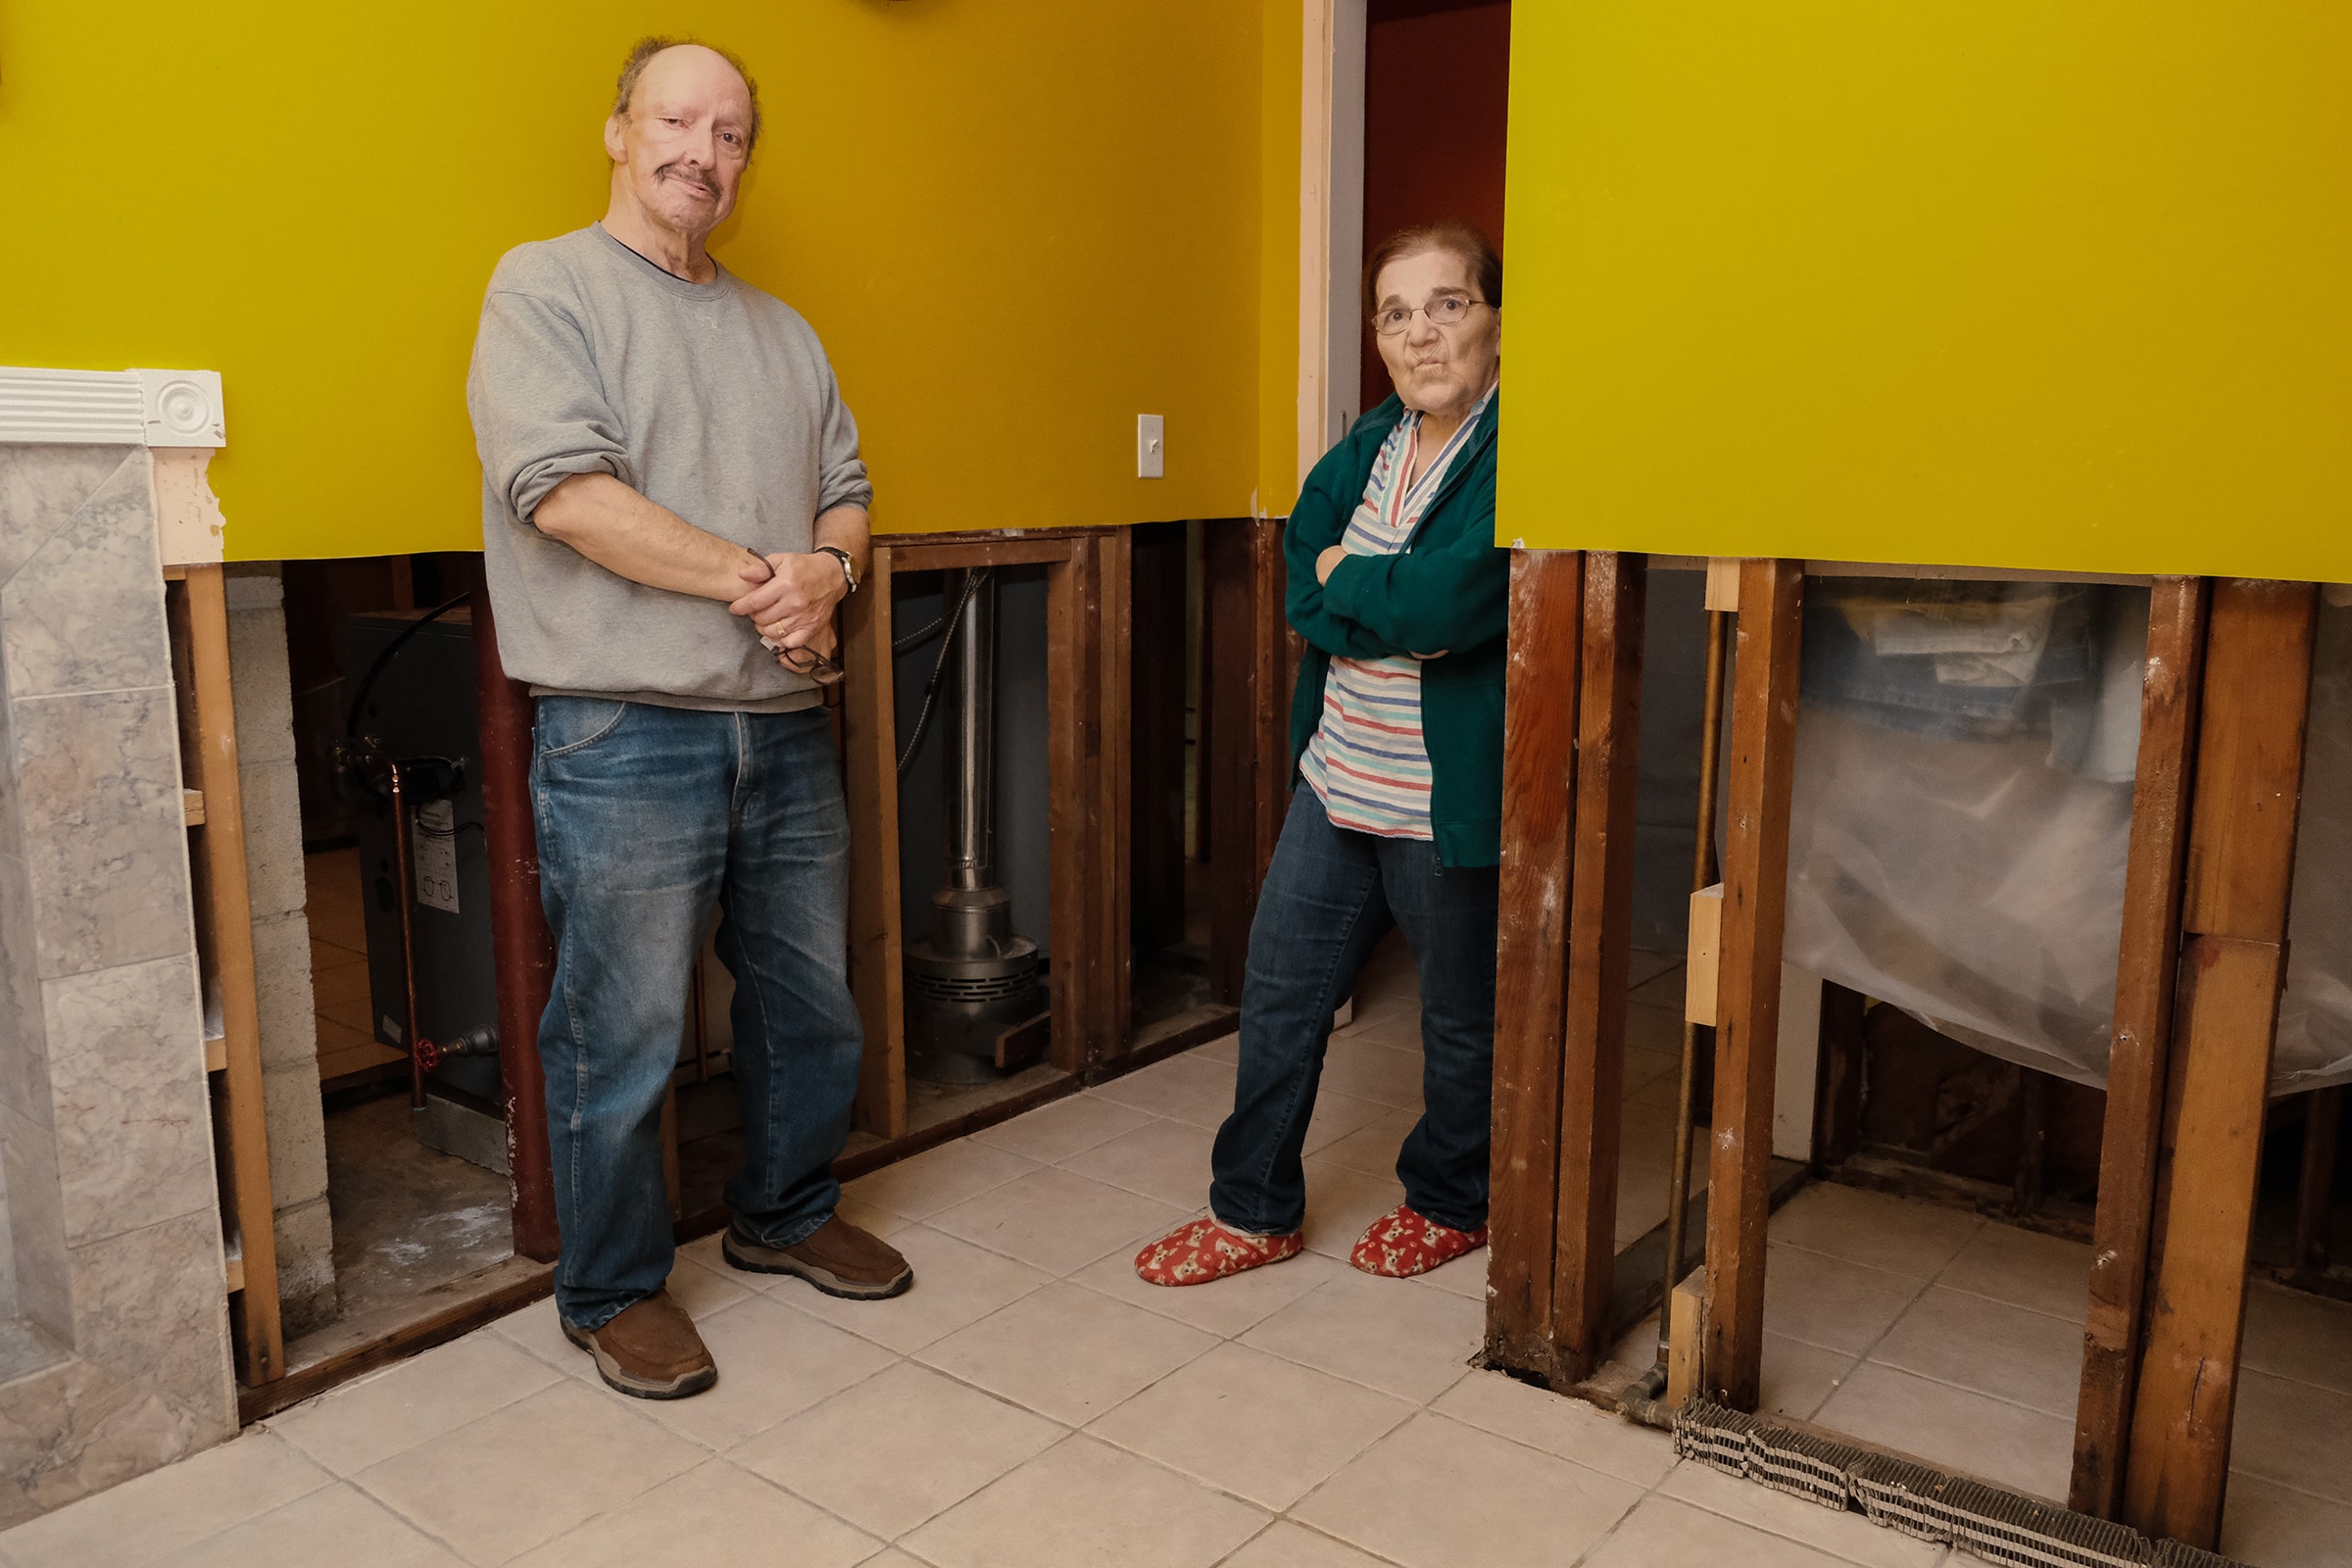
Ronald and Anne Marie Dutra live with their chihuahuas and Ronald’s brother on the other side of that empty stretch. They moved in eighteen years ago. “It’s a beautiful neighborhood, great place to live, great people,” says Ronald. “If I had known it would be like this I never would’ve moved in. No way.” In recent weeks the Dutras have gutted the bottom half of their basement and replaced the flooded boiler and furnace. “We don’t even travel anymore, we’re too afraid of the water,” says Anne Marie. “What are we going to do if it rains, turn the airplane around?”
They say they would have taken that buyout in 2011, but the money ran out before it reached them. Some states run proactive buyout programs with consistent funding sources, like New Jersey’s, backed by a corporate business tax. But in Rhode Island, people like the Dutras are offered buyouts only when local officials secure federal funding after a big storm. Demand is high, and hard-won pots of money purchase single-digit numbers of homes.
Residents on this street say the floods are getting bigger and more frequent, which is confirmed by government reports. 5 “Hundred-year flood, fifty-year flood; it’s just not true,” says Ronald Dutra. The shin-high concrete wall behind their house, which used to stop the water, might as well not be there.
The concept of a “hundred-year flood” is a way of articulating risk that has flowed downhill from expert planners to the general public. In popular use, it implies a regular rhythm to the occurrence of destructive storms. But the statistical definition — a one percent annual chance of flooding, as modeled by FEMA — describes a more uncertain reality. That this term has seeped into the public imagination is a testament to the reach of the National Flood Insurance Program.
Through the better part of the 20th century, there was simply no such thing as flood insurance for Americans living along rivers and coasts. 6 Without government support, private insurers did not have the capacity to map, model, and build the broad risk pools necessary to assess and distribute flood risk. But in 1968, advances in disaster research, coupled with the expansion of federal social programs under President Lyndon B. Johnson, created the conditions to pass the National Flood Insurance Act.
There are roughly five million policies in the National Flood Insurance Program, based on FEMA flood maps.
From its inception, the program contained a fundamental contradiction: offering subsidized, government-backed insurance would encourage development in flood-prone areas, worsening the original risk. 7 For that reason, the NFIP was set up as a carrot on a stick, with benefits that could be claimed only by municipalities that opted into federal building and land-use regulations. Theoretically, by restricting eligibility for insurance and disaster relief, the government could promote smart development in flood zones.
In some ways, the plan was a success. Today there are roughly five million NFIP policies, and FEMA flood maps are widely used by municipal zoning boards and planning departments. For buyers and sellers on the wrong side of the line, the maps put a price tag on risk. DuPont, the Warwick realtor, says he has seen clients with mandatory flood insurance pay annual premiums of $35,000.
Still, there are too many cases like the Dutras: low-lying residential neighborhoods using NFIP money to repeatedly gut and repair oft-flooded homes. The Dutras are happily insured, despite the high premiums. But subsidizing cases like theirs has plunged the program deep in debt. 8 Less than one percent of NFIP policies are held by “severe repetitive loss properties,” but they account for nearly thirteen percent of claim payments. 9
FEMA’s projections are also fallible, in part because they don’t account for climate change. When Hurricane Harvey devastated the Gulf Coast in 2017, more than 75 percent of flood-damaged homes in Houston were outside the one percent (or “hundred-year”) flood zone, and nearly half were outside the 0.2 percent (or “500-year”) zone. The storm inundated almost 100,000 homes in Houston that had been marked as safe on FEMA flood maps. 10
FEMA’s projections are fallible, in part because they don’t account for climate change.
Rhode Island has not experienced a storm on that scale in recent history, and no one knows whether the federal maps will prove accurate. There’s reason to be pessimistic. In 2014, scientists at the University of Rhode Island led by ocean engineering professor Malcolm Spaulding began work on a flood-risk mapping project for communities around Narragansett Bay. 11 FEMA had recently completed a major resurvey of the area, releasing maps of Potowomut and Conimicut Point that are still in use today. But Spaulding’s team (and the state’s Coastal Resources Management Council) saw holes in the methodology. So they started their own project, duplicating FEMA’s work, but with very different results. They called it Stormtools.
One key difference is in the resolution of these models. FEMA measures storm surge and wave heights at transects perpendicular to the coast. Between these transects, which are typically miles apart, data is estimated through a process of “linear interpolation.” In contrast, Spaulding’s team models data on a grid, with readings every 30 feet. Matched to aerial photos of high-risk areas from past storms, the minutiae modeled by Stormtools — washover points, surge points, small protected stretches — aligns with the photographic evidence. For their part, the FEMA maps show little variation between transects. Predicted flood data is mapped in large, rough blocks, covering whole neighborhoods with uniform values. Even more concerning, Spaulding’s team identified in the FEMA model a consistent bias in one direction. They say the agency has been systematically underestimating flood risk throughout the bay.
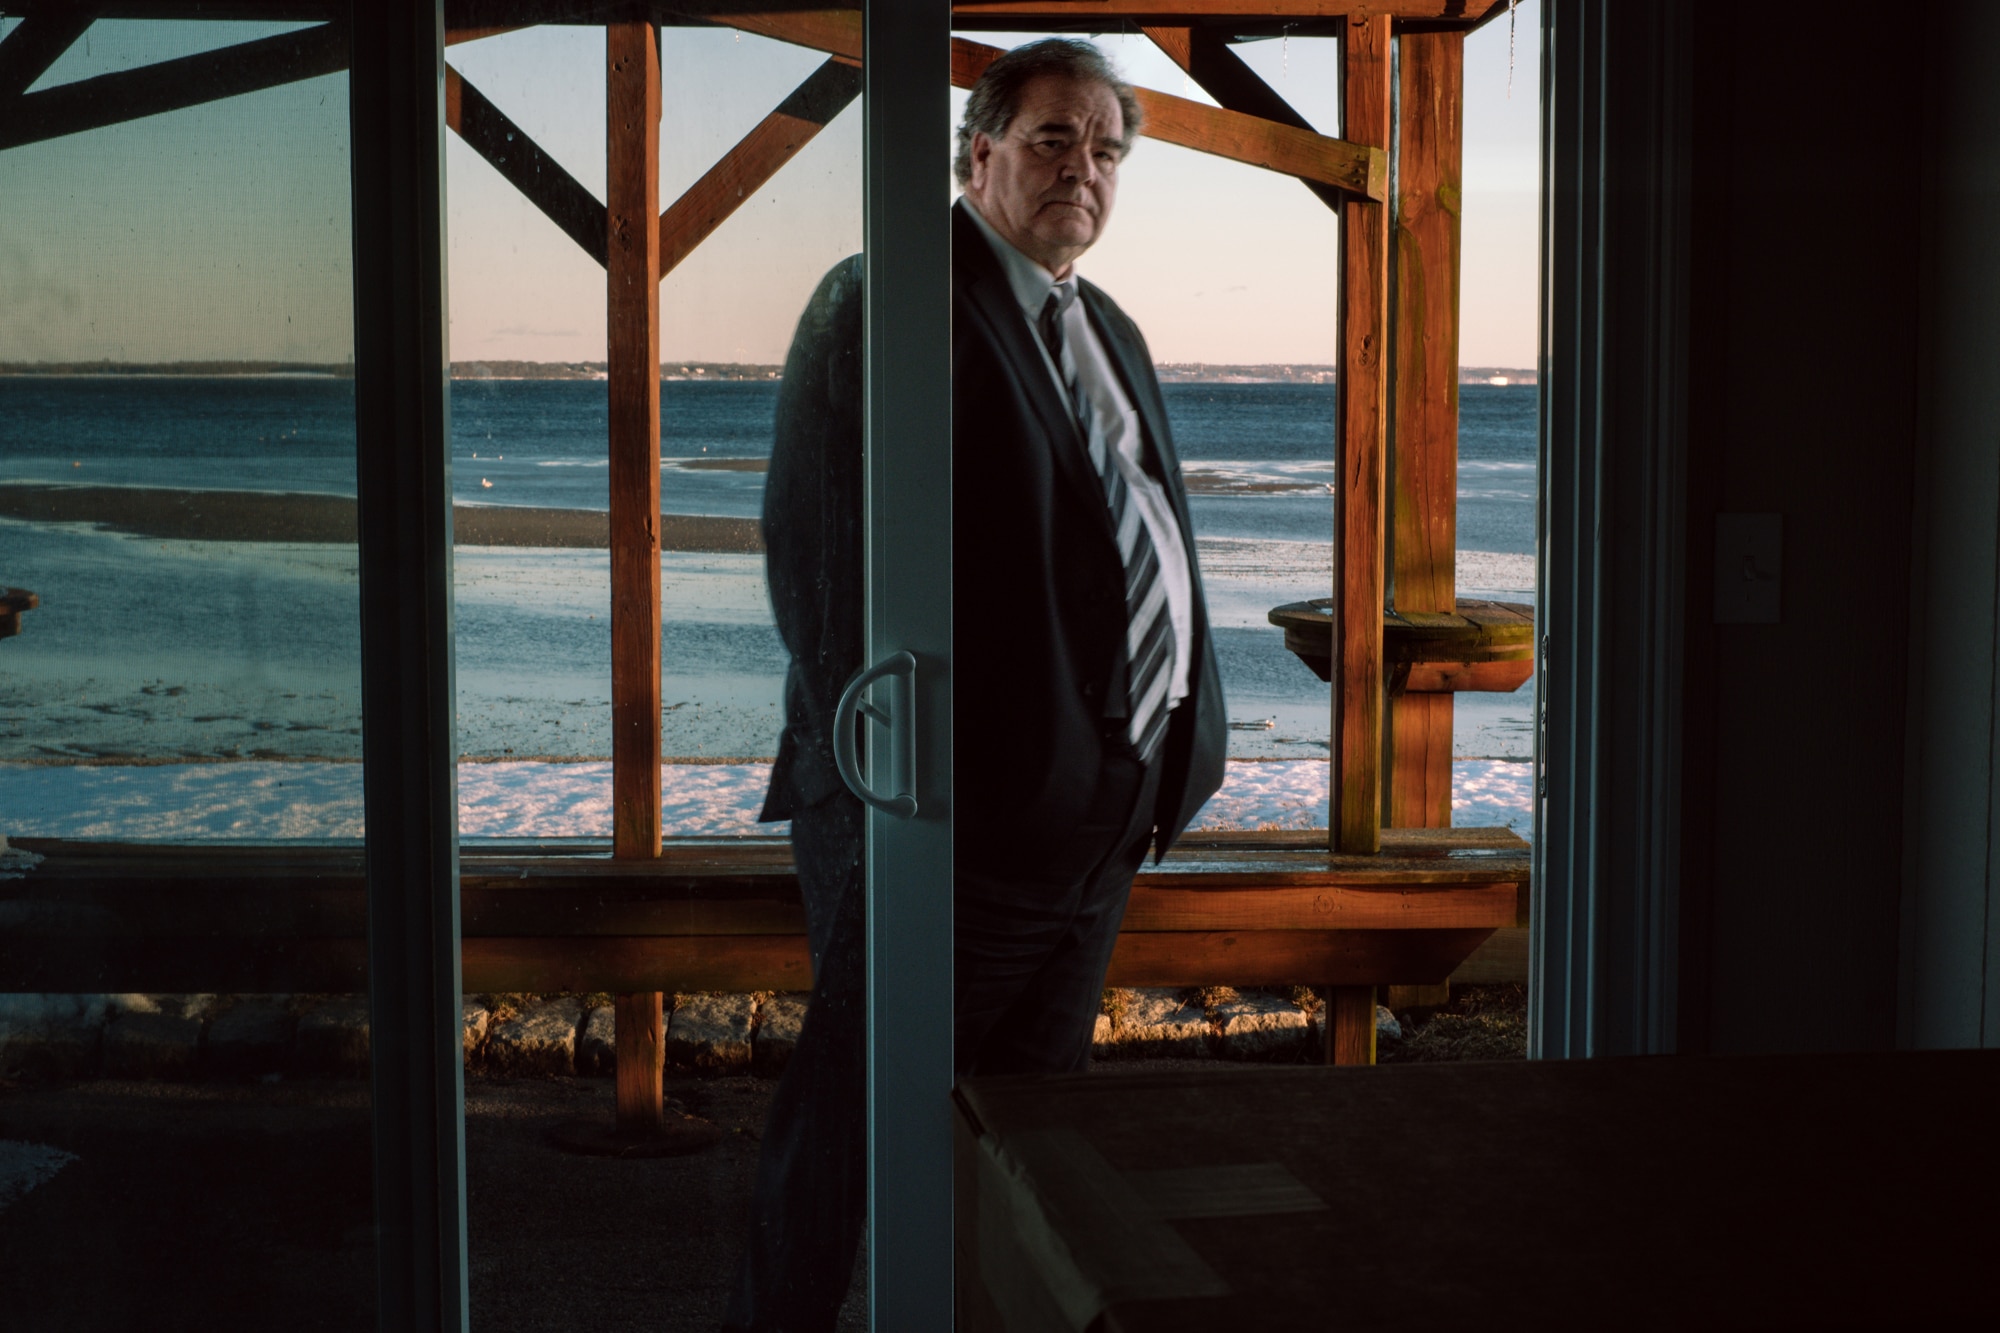
Jerry Quinn and Emely Lopez live two blocks away from Armand Deluise, at the end of Conimicut Point. According to FEMA, their home is in a risk zone that has a base flood elevation 16 feet above sea level. Stormtools puts that figure at 22.7 feet — more than half a story higher.
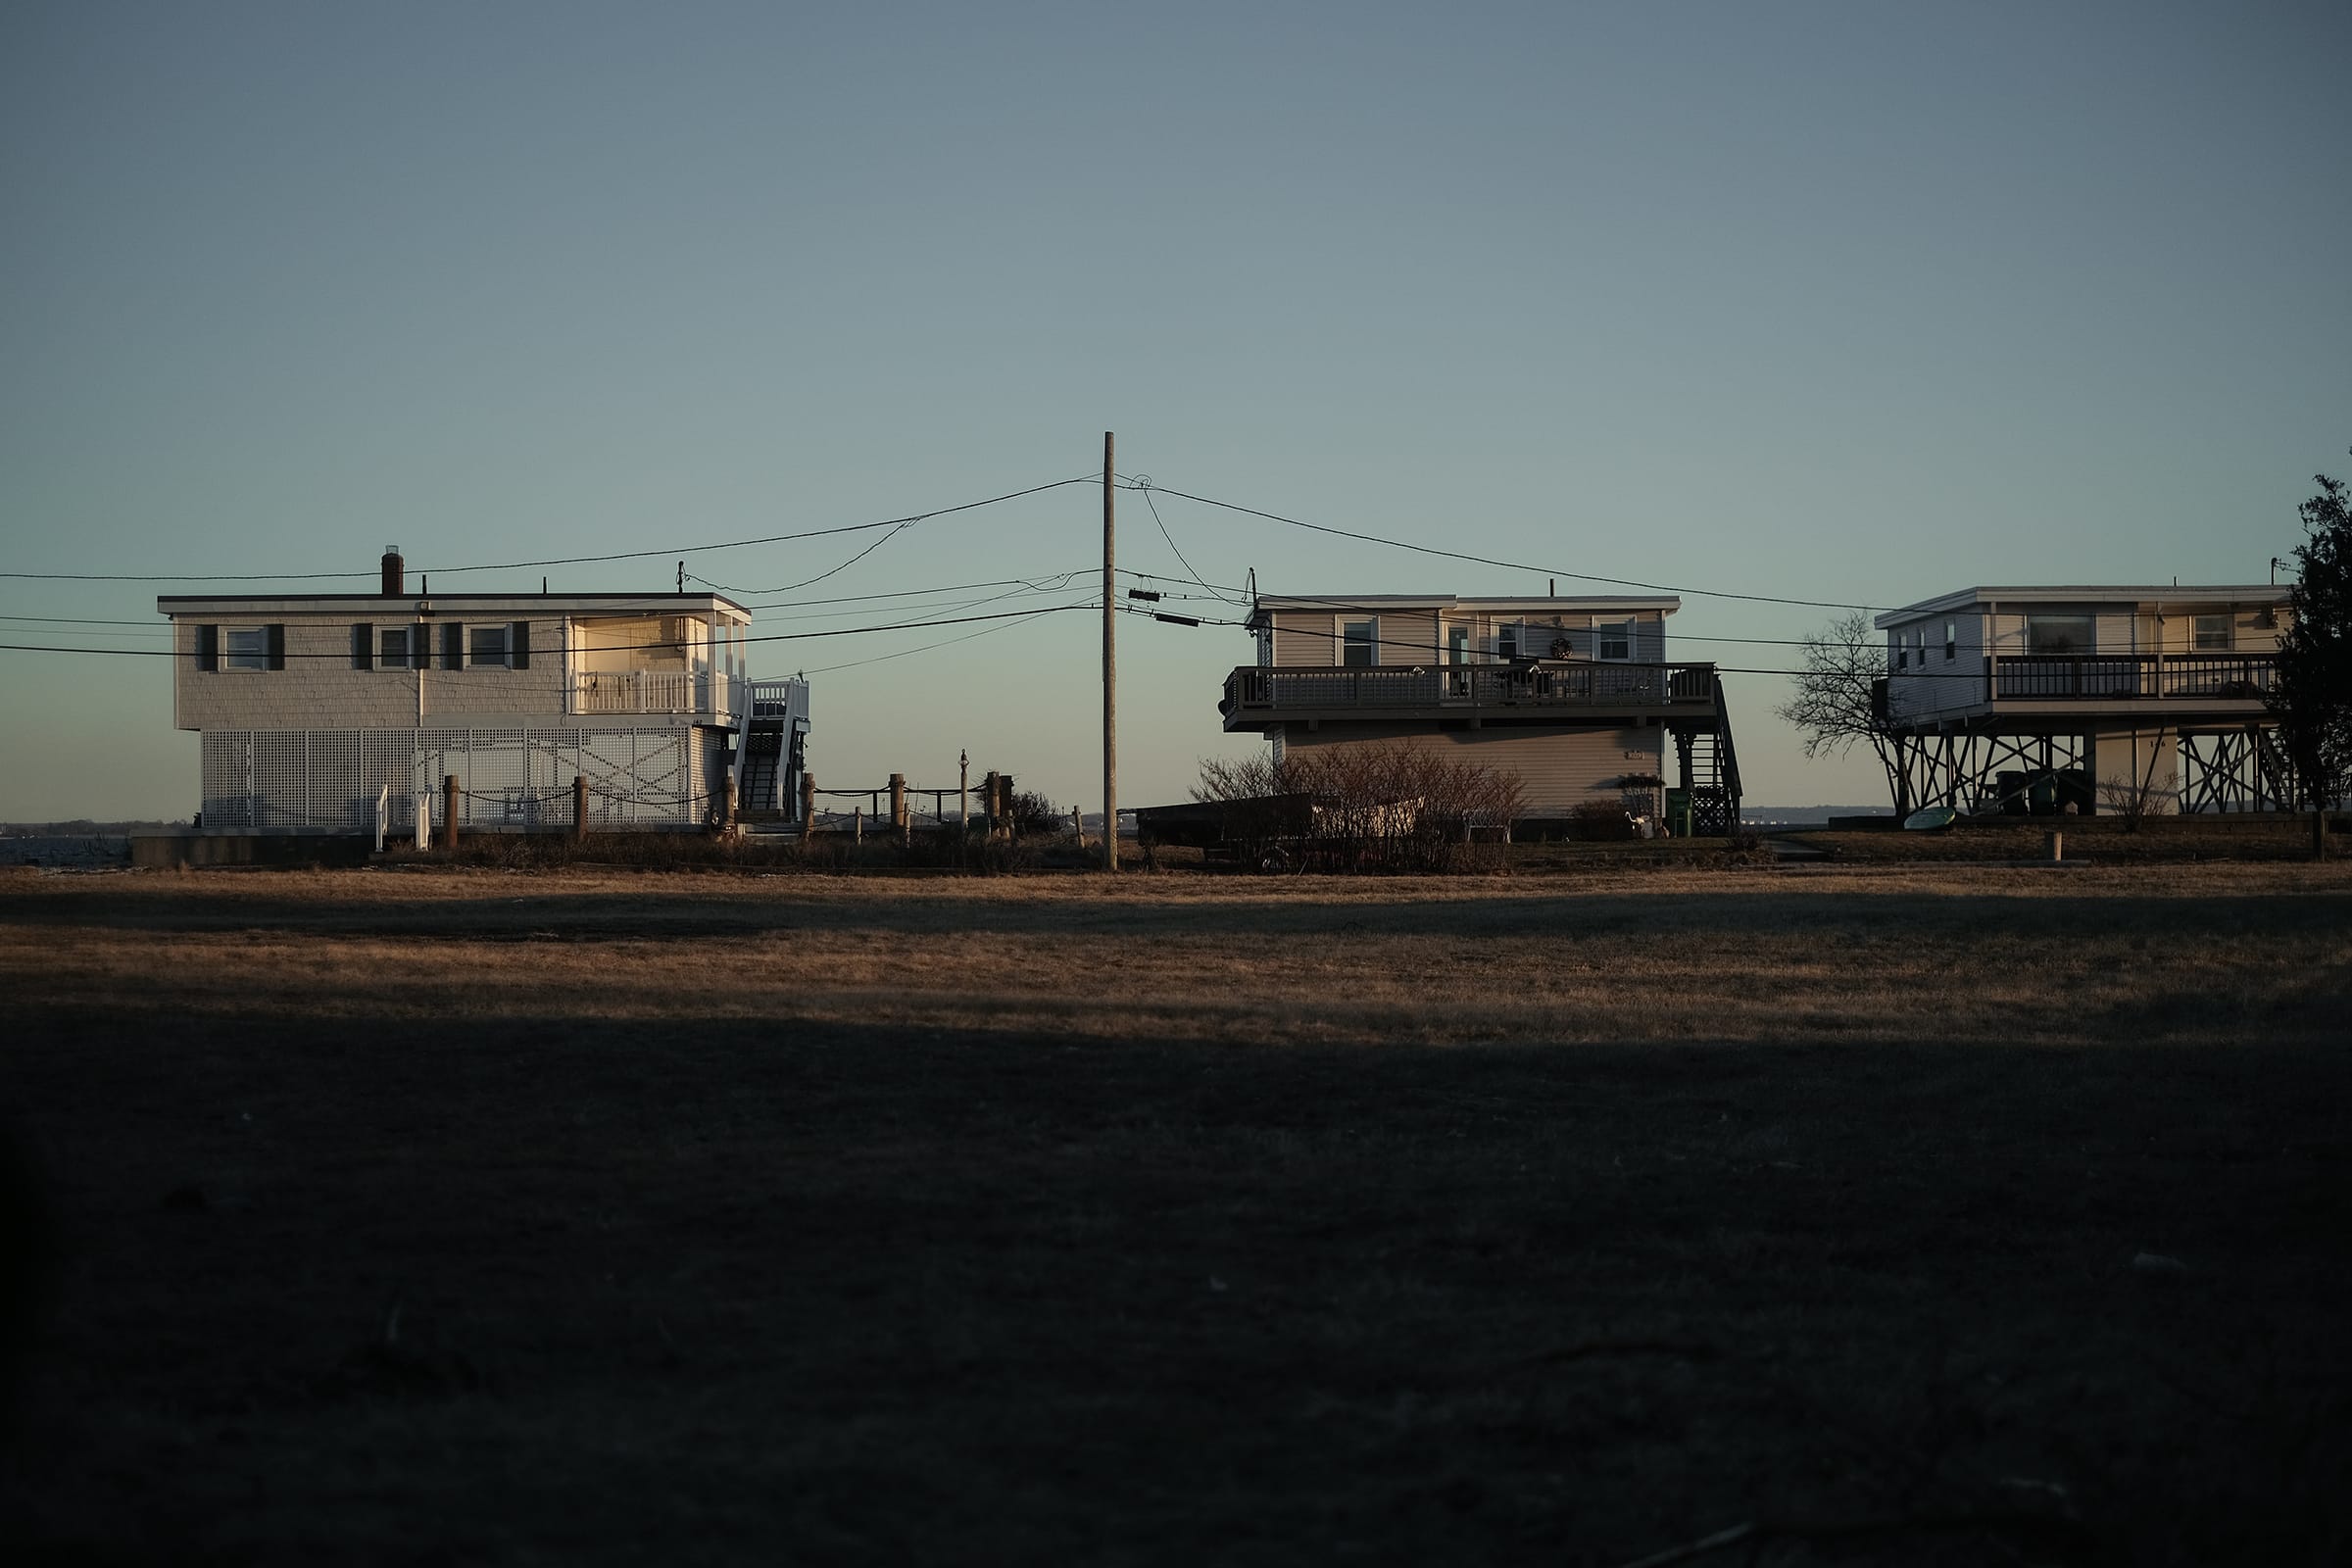
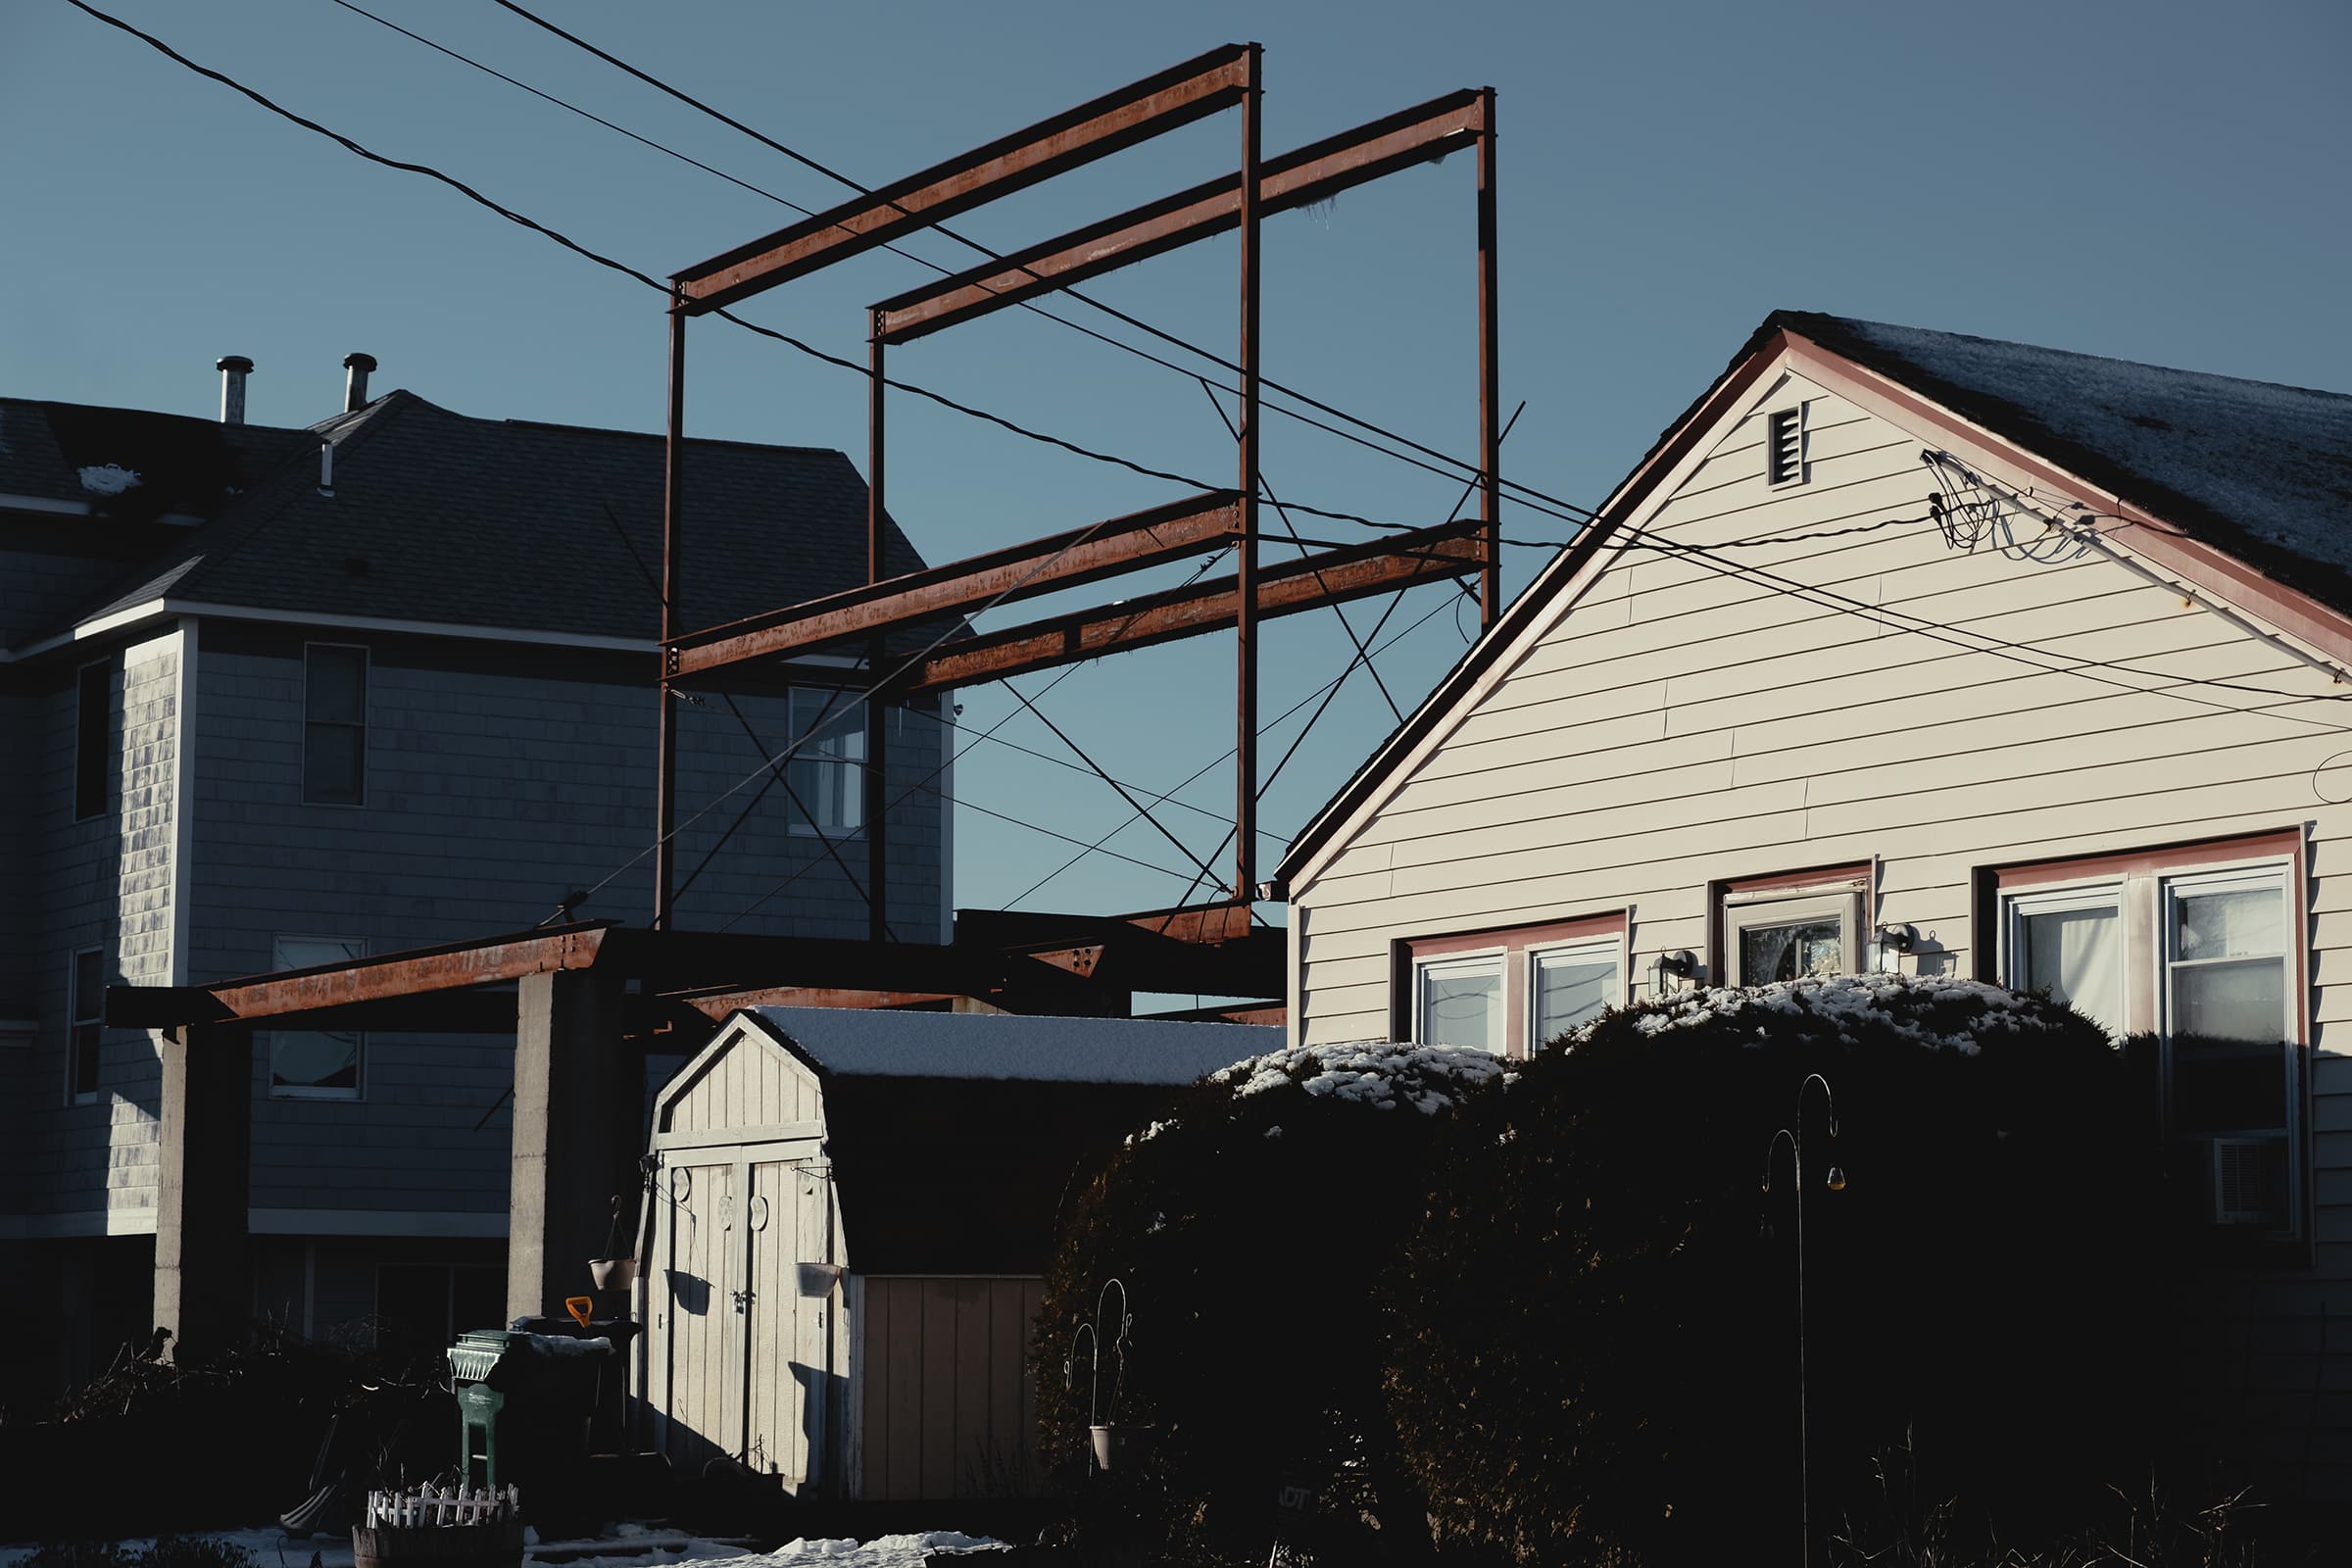
This year Quinn and Lopez slapped together a small barrier made of wood planks on the side of their house facing the bay. Quinn says it was just tall enough to divert water around the house in the January storm. They don’t count on it working next time, but that doesn’t worry them, because it’s not their main defense. The first floor of their house looks like an ordinary room, but it’s mostly tile, with pressure-treated wooden breakout walls between steel I-beams. The main living quarters are on the second floor. It’s a stilt home, more or less, with clothes on the legs.
If FEMA’s model is accurate, the raised living space should keep them safe. Quinn and Lopez say the highest water they saw was two years ago, when they had eighteen inches in and around the house. It receded within a day, they mopped the floors, and things went back to normal. They have a little back lawn, planted with Kentucky Bluegrass, which can withstand high salinity. Instead of raking leaves, Quinn rakes seaweed.
These kinds of adaptations are useful in places that periodically experience high waters, like king tides once a year. But if those tides now bring the ocean onto the street, what will happen in the next hurricane? Homeowners who rely on federal flood maps might be in for a surprise.
FEMA’s model for New England estimates storm surge using mean high-water levels measured at Narragansett Bay tide gauges, following the trend of observations over decades. 12 There’s a gradual, consistent, upward bend to the curve, reflecting the common-sense idea that higher waters occur less frequently. Most, but not all, tide-gauge readings fall along the trendline.
For homeowners, however, being mostly above the high water is no reassurance. As Spaulding observes, it’s outliers like major hurricanes that cause the most damage. His team estimates storm surge levels using the 95 percent confidence interval above the mean, which matches the hurricanes in 1938 and 1954. Spaulding also notes that FEMA’s model shows storm surge decreasing in magnitude as it travels north from the mouth to the head of Narragansett Bay, whereas Stormtools uses more advanced modeling by the U.S. Army Corps of Engineers, which indicates surges are amplified as they travel up the bay, potentially by 40 percent.
The differences in these models don’t register with residents. Quinn and Lopez say that in the past seven years, they’ve grown comfortable with their routines, living with the water, even if it means occasionally mopping out the ground floor or dealing with a flooded road. “This place is absolutely beautiful,” Quinn says. “These homes never sell. People love it here.”
‘By the time global warming is a problem for this house, I’ll be dead,’ says Quinn. But for all his experience, he’s wrong about the math.
Seven years is indeed a significant amount of observed evidence, watching the movement of the water, day in and day out, though it can be hard to put that experience in context. “In about 45 years,” says Quinn, the water level “will go up an inch. By the time global warming is a problem for this house, I’ll be dead.”
But for all his experience, Quinn is wrong about the math. That inch has already been exceeded in the time they’ve lived in Conimicut, and the National Oceanic and Atmospheric Administration projects another eight to fifteen inches of rise by 2050. 13
So why isn’t there a bigger push to improve FEMA’s Flood Insurance Rate Maps? One answer is in the name. While these maps are used by homeowners and local governments to assess risk, their primary function is to set insurance rates. So they have enormous impact on property values, and thus on the tax base for municipalities, on profits for developers and realtors, and on the pocketbooks of rate-paying homeowners — all magnified by the fact that waterfront property skews higher in value. Sustainable management of floodplains and coasts can be at odds with the short-term interests of these constituencies.
So why isn’t there a bigger push to improve FEMA’s Flood Insurance Rate Maps? One answer is in the name.
In 2012, with NFIP debt ballooning, a bipartisan congressional majority sought to make the program viable by pushing premiums towards real flood risk. The resulting bill, the Biggert-Waters Act, eliminated subsidized rates that had been grandfathered in from outdated calculations in the 1970s and ’80s. The act also increased rates for repetitive-loss properties and directed FEMA to coordinate with the Department of Defense, NOAA, and the U.S. Geological Survey to incorporate the most up-to-date mapping — essentially the data that feeds Stormtools. A technical advisory council was established to carry out these reforms and study the potential of adding climate science to flood insurance maps. 14
But the upshot of these efforts would be higher premiums for many homeowners. A national backlash ensued, led by an activist coalition called Stop FEMA Now, which was fronted by homeowners but officially backed by the National Association of Realtors and National Association of Home Builders. 15 In Rhode Island, the Warwick Beacon quoted outraged developers, realtors, and owners, who described rate increases as “almost like confiscation of one’s property” and “taking away the personality of the community.” 16

The following year, Congress passed the Flood Insurance Affordability Act, rolling back some rate increases and capping future increases of other subsidies. The advisory council applied the brakes on including climate change projections, noting, “If future conditions become linked to mandatory insurance requirement, an analysis of the impact to property owners may need to be conducted. Issues of equity and affordability associated with insurance premiums need to be considered.” 17 Now, a decade later, the question of who will pay for floods worsened by climate change stands unresolved. Hurricanes since Sandy and Harvey have posed that question with increasing urgency, while interest groups like Stop FEMA have forestalled an answer.
In some ways, their firsthand knowledge is more precise than even state-of-the-art climate models.
The homeowners on Conimicut Point aren’t fans of paying high premiums. Deluise, when he paid off his mortgage, stopped paying for flood insurance altogether. At the same time, they don’t deny climate change. They’ve adapted to living with the water, and in some ways, their firsthand knowledge is more precise and information-dense than even state-of-the-art climate models. But it’s also true that their knowledge is partial and occluded. Even Lacki’s 42 years on the peninsula — caring for four decades of children and grandchildren in the same home — is a mere heartbeat in geological time.

So they stay. They wall, they mop, they lift. Two houses down from Quinn and Lopez, Barbara Roach lives with her husband in a true stilt home, its one floor raised ten feet off the ground by steel girders. The water “comes up higher now and does more damage,” she concedes, gesturing at the porch next door, which was rebuilt after being destroyed by waves two years ago. But she trusts the measures she and her husband have put in place. “We’ve been here for 24 years, so we’re kind of used to it. Being up on stilts, we dodged a bullet big time.”
So they stay. They wall, they mop, they lift.
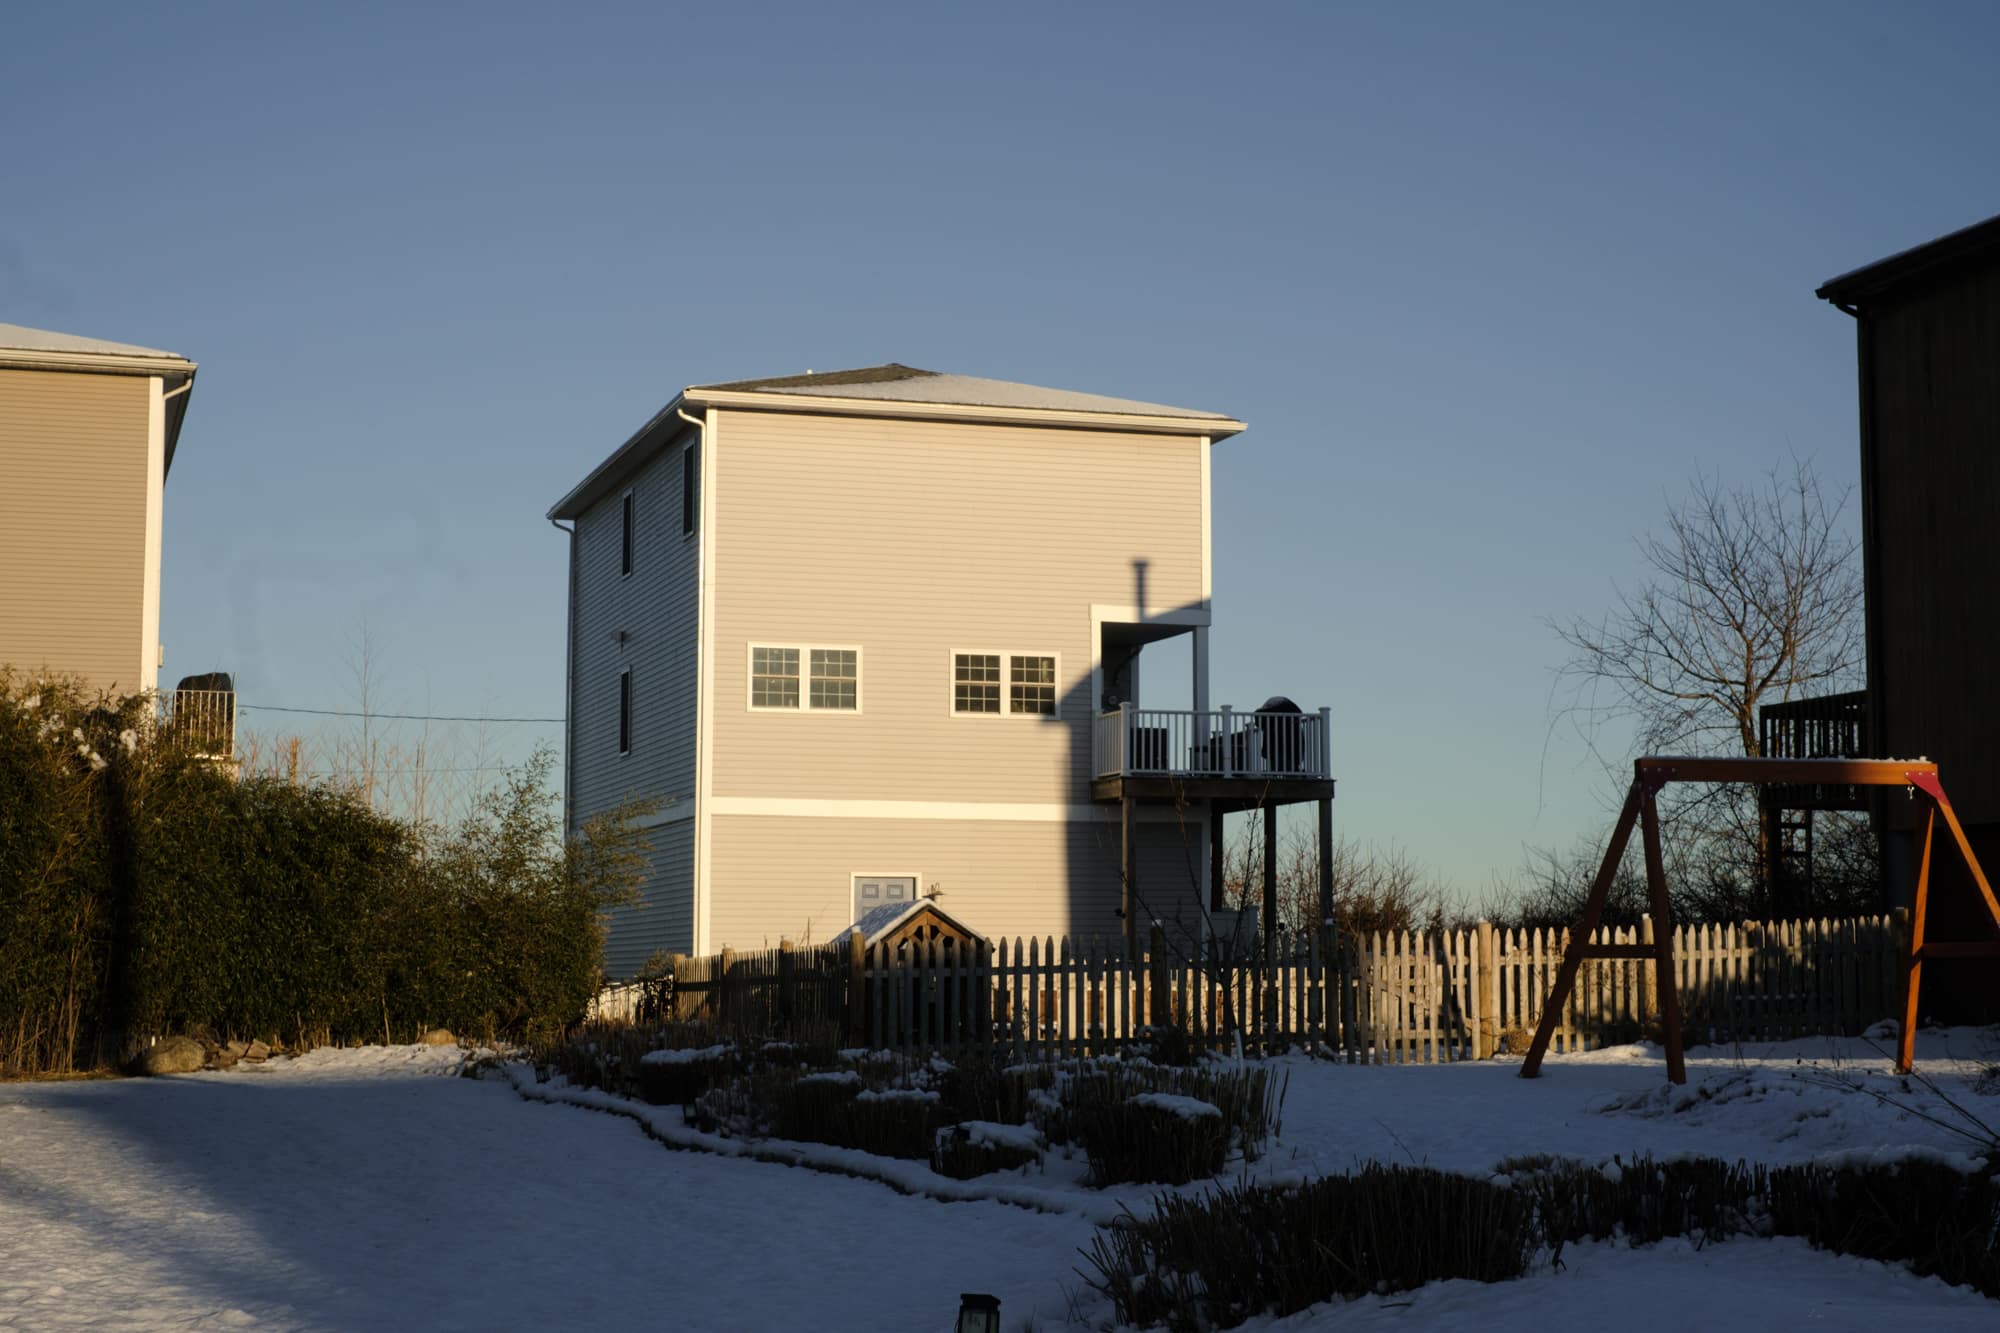
The Rhode Island building code agrees: houses are deemed safe if they’re raised above FEMA’s base flood elevation. Two new single-family homes are for sale on Spadina Avenue, built in 2023 on an empty lot next to John Lacki’s place. They look more like medieval keeps than beach houses, with the living space lifted above concrete garages meant to withstand the beating of storm surge — at least the twelve feet predicted by FEMA. Meanwhile, Stormtools’ model puts that number at 20.2 feet. Their consumer-facing app says the likelihood of wave damage in a hundred-year storm is 100 percent. That’s before factoring in sea level rise.
Down the street, there’s a stretch of beach in front of Roach’s house that is revealed at low tide. It’s a beautiful walk, and she goes often. She observes how the sands shift, uncovering buried structures: an old set of foundations, a house that used to be a part of this street of stilt homes, now demolished and below the tide line.


If you would like to comment on this article, or anything else on Places Journal, visit our Facebook page or send us a message on Twitter.